
TWO DECADES OF FUNCTIONAL IMAGING WITH MAGNETIC RESONANCE: FROM NUCLEAR SPINS TO CORTICAL COLUMNS
Accepted December 31, 2011
Keywords
fmri, high field, ultrahigh field, magnetic resonance
ABSTRACT
Since its introduction in 1992, there has been a revolution in the ability to image brain function with functional magnetic resonance (fMRI), going from early experiments demonstrating relatively course images of activity in the visual cortex to mapping cortical columns and to "brain reading" that constructs mental experiences of an individual, all using the fact that we were endowed with a complex paramagnetic molecule sequestered in our blood vessels and that neuronal activity has spatially-specific metabolic and physiologic consequences. These two decades of fMRI is marked by incessant improvements in instrumentation, innovative developments in image acquisition and reconstruction methods, and a significant expansion in our knowledge of neurovascular coupling. Collectively, this body of work has brought us recently to the point of depicting functional activity in three dimensions, in the entire human brain with submillimeter resolution. Some aspects of these accomplishments and the rational for their pursuit is reviewed and presented together with a personal history of the development of fMRI.
Contents
- INTRODUCTION 122
- DEVELOPMENT OF fMRI 124
- MECHANISTIC CONSIDERATIONS 130
- Extravascular effects 131
- Intravascular effects 134
- Inflow effects in bold-based fMRI 135
- Modeling of fMRI signals 136
- SPATIAL SPECIFICITY OF BOLD fMRI 139
- Specificity of perfusion changes coupled to neuronal activity 144
- Spatial accuracy of MR signals in functional mapping 148
- HIGH RESOLUTION WHOLE BRAIN fMRI 151
- DECODING AND ENCODING WITH BOLD fMRI 156
- CONCLUSIONS 158
- APPENDIX 1: Extravascular BOLD EFFECT 158
- APPENDIX 2: Brief introduction into data acquisition in fMRI 160
- ENDNOTES 164
- REFERENCES 165
INTRODUCTION
In 2012, functional magnetic resonance imaging (fMRI) based on blood oxygen level dependent (BOLD) contrast will be two decades old. Because of this two-decade milestone, there has been a flurry of activity to publish historical accounts and personal perspectives. In this spirit, I have decided to include a personal perspective in this article intermixed with a review of fMRI because functional imaging has been a central research focus since its discovery in the laboratory that I lead, the Center for Magnetic Resonance (CMRR) at the University of Minnesota. For this laboratory, the development of fMRI also coincides with and is intertwined with the development of high (4 Tesla) and ultrahigh fields (7 Tesla and above) for magnetic resonance (MR) imaging. As such this personal perspective also includes a history of high and ultrahigh field MR.
Since its introduction in 1992 (Bandettini et al. 1992; Kwong et al. 1992; Ogawa et al. 1992), there has been a revolution in the ability to image brain function, going from early experiments demonstrating relatively course images of activity in the visual cortex, to mapping cortical columns, and to brain reading that constructs mental experiences of an individual, all using the fact that we were endowed with a complex paramagnetic molecule sequestered in our blood vessels and that neuronal activity has spatially-specific metabolic and physiologic consequences. Today, it is possible to depict functional activity in three dimensions in the whole brain with approximately a millimeter resolution, and image with even higher spatial resolution at the level of cortical columns in restricted volumes (Menon et al. 1997; Cheng et al. 2001; Goodyear and Menon 2001; Fukuda et al. 2006; Sun et al. 2007; Yacoub et al. 2007; Yacoub et al. 2008; Chaimow et al. 2011; Shmuel et al. 2010; Zimmermann et al. 2011). An example of the latter includes orientation columns that were never previously visualized in the human brain but were successfully mapped with fMRI at 7T (Yacoub et al. 2008) in the primary visual area V1 together with ocular dominance columns (ODC), revealing the organizational relationship between them (Yacoub et al. 2008) (Figure 1). While a lot has been known about human ODCs for quite some time due to the ability to image them even in the postmortem brain, orientation columns require functional methods for their depiction and were never imaged in humans before. It was possible to do so only with a major effort to push fMRI to ultrahigh magnetic fields1, develop new image acquisition strategies, and subsequent to extensive theoretical and experimental studies that made significant inroads into understanding the complex set of mechanisms underlying the coupling between neuronal activity and MRI signals. This combined effort was indispensible for attaining improvements in spatial accuracy, functional contrast to noise ratio (fCNR), and intrinsic image signal-to-noise ratio. This review focuses on these methodological developments that ultimately enabled some of the most advanced applications of fMRI in the human brain.
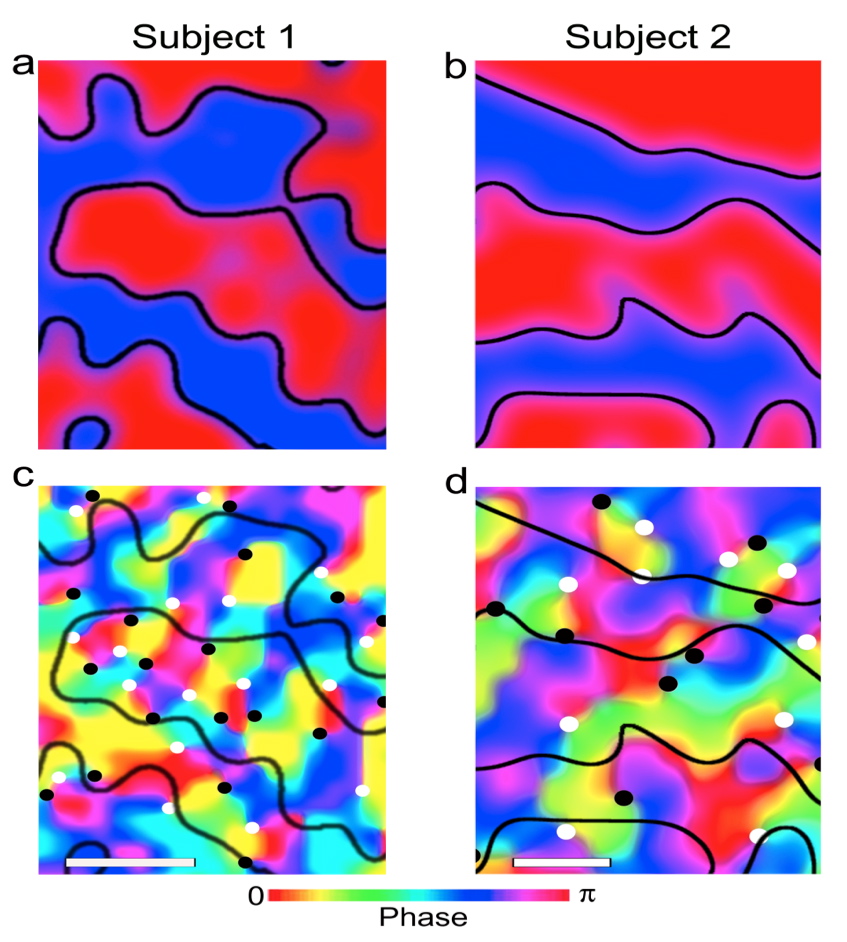
FIGURE 1: Functional maps of ocular dominance columns (a, b) and orientation columns (c, d) in the human brain obtained with SE fMRI at 7 Tesla in two subject. The black lines in (c), and (d) depict the boundaries of the ocular dominance columns seen in (a), and (b), respectively. The black and white dots in c and d identify the centers of clockwise and counterclockwise rotating pinwheels with each color representing an orientation. The white bars (lower left hand corner in (c) and (d) designate 1 mm scale. From Yacoub et al. 2008.
DEVELOPMENT OF fMRI
The first functional images of the human brain were obtained using an exogenous, gadolinium based contrast agent that was at the time (and still is) available for clinical use (Belliveau et al. 1991). Although this was an exciting development, the approach has many shortcomings: It required two bolus injections of contrast agent, separated by many minutes, for a single functional map, limited amount of time for data acquisition during the transient bolus passage through the brain, and a limited number of possible repeated contrast agent injections due to accumulation of the contrast agent in the blood and, hence, the saturation of relaxation enhancement with additional injections. Ultimately, human applications of this technique would have been limited by safety concerns because gadolinium-containing contrast agents have become a suspected causal factor for nephrogenic systemic fibrosis (NSF) (e.g. Marckmann et al. 2006; Kuo et al. 2007). Because of all these reasons, it would not have been possible with this technique to perform all the incredibly information-rich and complex fMRI studies that are feasible today, and the impact on understanding brain function would have been quite modest. Fortuitously, the exogenous contrast agent based functional imaging approach was rapidly followed by what is now often referred to as BOLD fMRI. This technique relies on intrinsic contrast mechanisms associated with deoxyhemoglobin changes and, as such, does not suffer from the shortcomings of the exogenous contrast based method. Clearly, it is this latter development that revolutionized the study of brain function. We at CMRR at the University of Minnesota were one of two groups that independently and simultaneously initiated and conducted the experiments that introduced fMRI (Ogawa et al. 1992), the other being the group at Massachusetts General Hospital (MGH) (Kwong et al. 1992), an effort that is largely credited to Ken Kwong. A third group from the Medical College of Wisconsin, Milwaukee also reported results of functional imaging in the human brain the same year (Bandettini et al. 1992). However, this group acknowledged being motivated by results from the MGH effort.
The fMRI in CMRR came about because of the work Seiji Ogawa did at Bell Labs, introducing the BOLD effect (Ogawa et al. 1990; Ogawa et al. 1990; Ogawa and Lee 1990). These early experiments conducted on rats were not directly on functional imaging and did not show functional mapping; rather, they demonstrated that metabolic perturbations such as hypoglycemia and graded levels of oxygen in the inhaled gas mixture affected the visibility of venous blood vessels. These perturbations altered the visibility of intracortical blood vessels that were detectable in gradient recalled echo (GRE) images of the rat brain where a delay echo time (TE) is inserted between the excitation of spins and their subsequent detection to generate an image. This effect was ascribed to intravoxel magnetic field inhomogeneity induced by magnetic susceptibility differences between the blood vessel interior and the extravascular space; the origin of the susceptibility gradient itself was assigned to the presence of paramagnetic deoxyhemoglobin compartmentalized within the blood vessels. Therefore, in MR images sensitized to magnetic field inhomogeneities, such as simple GRE images with a TE delay, signal intensities are altered if the regional deoxyhemoglobin (dHb) content is perturbed. Thus, the BOLD effect, as described was an extravascular effect impacting water molecules in the surrounding tissue and cerebrospinal fluid (CSF).
Although the original BOLD effect was demonstrated with metabolic and physiologic perturbations, the dHb changes that are the ultimate source of the BOLD effect can occur with alterations in brain activity because of spatially specific metabolic and hemodynamic responses to enhanced neuronal activity. It was earlier suggested that in response to stimulus induced neuronal activity, regional cerebral blood flow (CBF) increases while the cerebral metabolic rate of oxygen consumption (CMRO2) in the same area is not elevated commensurably (Fox and Raichle 1986; Raichle 1987; Fox et al. 1988), implying that with increased neuronal activity, O2 extraction fraction, and subsequently dHb content per unit volume of brain tissue would decrease. The regionally specific CBF changes coupled to brain activity was well known and accepted at the time fMRI experiments were being attempted and was in fact used for the very early human functional imaging experiments using xenon, and later by positron emission tomography (PET) (Raichle 2009). It was also well known at the time that these activity-induced CBF increases are also accompanied by commensurate elevations in glucose consumption rate. However, the concept that CMRO2 did not increase equivalently as CBF was controversial at the time, in part because it was quite counterintuitive given the extreme aerobic capacity of the brain and, in part, because the PET measurements of CMRO2 are complex.
Nevertheless, if the cerebral dHb content changes with altered neuronal activity induced by a stimulus or a task relative to a basal state, so will the BOLD effect in regions of the brain engaged in this task or stimulus, leading to a functional brain image (i.e. to fMRI). This served as the motivation to explore functional imaging using the very simple strategy of collecting gradient recalled echo images with a delay between signal excitation and reception, expecting the BOLD effect to provide functional contrast.
I became aware of Ogawa's original work on the BOLD contrast from various conferences which we both attended. I had seen some of his presentations (e.g. the 1999 annual meeting of the Society of Magnetic Resonance in Medicine (SMRM) in Amsterdam), and also discussed this work informally when we met. Seiji Ogawa and I knew each other well; we were colleagues that had worked together for several years in the same group at the Bell Laboratories, focused on establishing in vivo applications of the magnetic resonance phenomenon. The link to oxygen metabolism, at the time my research focus, albeit in the heart and not in the brain, is what initially attracted my attention to the BOLD effect. Although the original description of the BOLD contrast was based on manipulation of blood oxygenation levels in the rat model through pharmaceutical and/or metabolic interventions, in his paper published in the Proceedings of the National Academy of Sciences, USA (PNAS), submitted in August 1990 and published in December 1990 (Ogawa et al. 1990), Ogawa and his coworkers suggested the use of this method possibly to achieve functional imaging in the brain, in a way analogous to the PET approach but, unlike PET, using an endogenous contrast mechanism instead.
The original work on the BOLD effect was carried out in the late 1980s. At about the same time, we at CMRR were attempting to establish a human imaging and spectroscopy capability based on 4 Tesla magnetic field strength, at a time when the magnetic field used in high-end instruments was 1.5 Tesla. The 4 Tesla system provided an opportunity to pursue unique experiments that had the potential to provide distinctive results, especially using imaging mechanisms based on magnetic susceptibility. In this context, Ogawa and I started discussing the possibility of working together to achieve functional imaging in the human brain using the BOLD contrast and the 4 Tesla system (this was even before the Ogawa et al. 1990 PNAS paper was submitted). We were simply waiting for this instrument to arrive and become adequately operational before we started the fMRI experiments. Had the 4T system been delivered earlier or had it functioned right away we would have achieved fMRI earlier.
As we waited for the 4T to become operational, we did not think of pursuing fMRI at 1.5T because we were focused on the susceptibility mechanism of the BOLD contrast. Magnetic field perturbations in a sample, caused by the presence of boundaries between compartments of different magnetic susceptibility, increase linearly with the external magnetic field applied. The original rat experiments on the BOLD effect were performed mainly at 7 Tesla, and to a lesser extent at 4.7 Tesla. The latter was close to the magnetic field we were going to establish for human studies. As such, we thought 4 Tesla would be adequate to detect brain function with the BOLD mechanism, if deoxyhemoglobin changes coupled to neuronal activity were as large as predicted from the existing PET data of the time. We did not think BOLD fMRI would work at low fields like 1.5T. In principle, we were right. Today, we know that the fMRI signal is quite complex and has numerous contributions (discussed in greater detail later on); such contributions include inflow effects that are mostly associated with flow increases in large blood vessels (e.g. Duyn et al. 1994; Segebarth et al. 1994) and that are field independent, intravascular effects due to changes in blood T2 and T2* (e.g. Duong et al. 2003; Silvennoinen et al. 2003) that actually are prominent at lower magnetic fields (e.g. 1.5 Tesla), and signal changes associated with large veins with diameters that are of the order of the voxel size (e.g. Hoogenraad et al. 1999), again an effect that is prominent at lower fields such as 1.5T . Extravascular BOLD effect arising from intracortical veins and capillaries is relatively small, if present at all, at 1.5T (e.g. Hoogenraad et al. 2001), but becomes significant at high and ultrahigh fields. As such, 1.5T fMRI data are mostly associated with large veins but because they are acquired at low resolution, they appear spread out, looking similar to what is seen in PET functional images. Nevertheless, for many questions these functional maps provide adequate resolution and have produced useful results.
When the 4 Tesla instrument finally did arrive in 1990, much had to be done to bring it to an operational state since this system was not a well-developed platform. In addition, the magnet was damaged during transport, and had to be repaired, causing a significant delay. Echo Planar Imaging (EPI) that has now become the most commonly employed imaging approach for fMRI was not available generally on any system, let alone a 4 Tesla system. We used gradient recalled echo imaging (i.e. FLASH). We were collecting data sometime early in 1991. Obviously, in these early experiments, we worried if the results were real, if they were motion artifacts, or instrumental glitches etc. We also expected the stimulation-evoked signal to be a decrease relative to the baseline state, being prejudiced with familiarity of strongly coupled oxygen consumption increases associated with work and metabolism in other systems. We were aware of the Fox and Raichle paper reporting minimal to no oxygen consumption change with visual stimulation studies with PET-based measurements of oxygen consumption (Fox et al. 1988), but, as many others in the field, were skeptical of it. When we started to be convinced that we were seeing stimulus-induced positive signal changes due to visual stimulation, we had to acknowledge that at least qualitatively, the PET data were correct after all.
By the time we went to the Society of Magnetic Resonance in Medicine (SMRM) annual meeting that was held in San Francisco in August 1991, we had functional images and so did MGH. I think, however, that the MGH colleagues and us were likely being very cautious since this was such new territory and signal changes observed so small. Otherwise both groups would have rushed to publish these unique results. Yet it took more or less another six months or so before the papers from these two groups were submitted for publication within five days of each other.
We submitted our paper to Nature. It was rejected without being sent for scientific review, with the usual rejection letter saying that it was not of general interest. After the rejection, we recouped and sent it to Proceedings of the National Academy of Sciences, USA (PNAS) where it was received in March 1992 and appeared in press in July 1992 (Ogawa et al. 1992).
Since the introduction of BOLD based fMRI, other MRI techniques have also been developed for functional brain mapping. It is now also possible to generate functional maps based on relative or absolute measures of CBF change (e.g. Kwong et al. 1992; Edelman et al. 1994; Kim 1995; Kim and Tsekos 1997; Wong et al. 1998; Wong et al. 2006; Wu and Wong 2006; Wu and Wong 2007; Pohmann et al. 2010) or change in the cerebral blood volume (CBV) (Lu et al. 2003; Lu et al. 2005) coupled to neuronal activity using intrinsic signals. The CBF techniques rely mostly on tagging the blood spins differentially inside and outside of a well-defined volume. CBV techniques in the human exploit the fact that blood spin-lattice relaxation rate T1 is different for tissue and blood so that the blood signals can be nulled while signals remain detectable from tissue and cerebral spinal fluid (CSF). Consequently, changes in CBV lead to a change in the total signal coming from an image voxel as the fraction of the voxel volume occupied by blood is altered in response to neuronal activity. In animal models, a commonly employed approach uses intravascular exogenous contrast agents that stay within the blood vessels for a long period of time (e.g. Mandeville et al. 1996; Mandeville et al. 1998; Mandeville and Marota 1999; Mandeville et al. 2001; Leite et al. 2002; Mandeville et al. 2004; Zhao et al. 2006; Goense et al. 2007; Smirnakis et al. 2007; Zhao et al. 2007), but this approach is not usable in humans because of toxicity issues. However, none of these approaches has been able to replace BOLD-based fMRI in human studies, because of a variety of shortcomings associated with the different techniques, such as smaller functional contrast-to-noise ratio, difficulty of rapid whole brain coverage, and/or inapplicability to humans because of toxicity issues (in cases of exogenous contrast).
MECHANISTIC CONSIDERATIONS
In the quest to improve spatial accuracy of functional images, efforts to understand the complex set of mechanisms underlying the coupling between deoxyhemoglobin containing blood vessels and MRI signals have been crucial. Modeling studies have been at the heart of this effort, starting with the first modeling paper from our group (Ogawa et al. 1993) immediately following the introduction of fMRI. Since then, several groups have published on this topic (e.g. Boxerman et al. 1993; Ogawa et al. 1993; Weisskoff et al. 1993; Kennan et al. 1994; Weisskoff et al. 1994; Yablonskiy and Haacke 1994; Bandettini and Wong 1995; Boxerman et al. 1995; Boxerman et al. 1995; van Zijl et al. 1998; Kiselev and Posse 1999; Fujita 2001; Kjolby et al. 2006; Uludag et al. 2009). Here, some of the important aspects of these findings are summarized, without going into detail.
BOLD contrast reports on the overall deoxyhemoglobin content in an imaging voxel. In the brain, this is determined by two parameters: 1) the deoxyhemoglobin concentration in blood and 2) the total amount of deoxyhemoglobin containing blood volume in a given volume of brain tissue. The former is directly proportional to the CMRO2/CBF ratio, i.e. the rate at which oxygen is consumed compared to its rate of delivery. Magnetic field inhomogeneities generated in and around blood vessels because of the presence of the paramagnetic deoxyhemoglobin depends on vessel diameter. Consequently, blood vessels play a critical role in the coupling between alterations in neuronal activity and MR detectable signals. The nature of the MR detectable signals also depends on parameters other than physiology, namely magnetic field magnitude and the type of pulse sequence used.
Extravascular Effects
The BOLD effect has two components: extravascular and intravascular (i.e. blood related). First, let us focus exclusively on the extravascular space. When a sample, such as the human brain, is introduced into a static magnetic field, as encountered inside the magnet of an MRI instrument, the magnetic field in the sample is not necessarily equal to the value the magnet generates in air. That is because all matter, including biological tissue, has magnetic properties; consequently, an external magnetic field induces additional magnetic fields in any sample, which are generated by the sample itself in response to an external magnetic field. This is conceptualized by the property called magnetic susceptibility. Most biological tissues, including oxygenated blood, are diamagnetic, that is they generate a very weak magnetic field that opposes the external magnetic field. However, deoxyhemoglobin is strongly paramagnetic, creating an additional magnetic field that is aligned with the external magnetic field. Thus, oxygenated blood and tissue have similar magnetic susceptibility, but in the presence of dHb, magnetic susceptibility of blood is significantly different inside versus outside the blood vessel containing dHb. In the presence of a large susceptibility difference between inside and outside of a blood vessel, the magnetic field inside the blood vessel becomes significantly different than outside, and the homogeneity of the magnetic field outside the blood vessel is perturbed in the vicinity of the luminal boundaries of the blood vessel; this extravascular perturbation is illustrated in Figure 2, approximating for simplicity, the blood vessel is shown as an infinite cylinder with a different magnetic susceptibility relative to its surrounding; many salient features of the physics of this problem can be understood with this simplification (See Appendix 1).
The magnetic field is homogeneous inside such a cylinder2, and inhomogeneous outside in the vicinity of the cylinder. At any point outside the cylinder, the magnetic field will vary depending on the distance from the blood vessel and orientation relative to the external magnetic field direction. The magnitude of the magnetic field change induced outside the cylinder will be proportional to the applied external magnetic field, i.e. the magnetic field of the instrument used (1.5 Tesla, or 7 Tesla etc.). This is fundamentally the origin of the relevance of field strength in fMRI and why we try to use higher magnetic fields such as 7 Tesla, instead of operating at 1.5 Tesla. There are, of course, many other considerations that come into the field dependence issue.
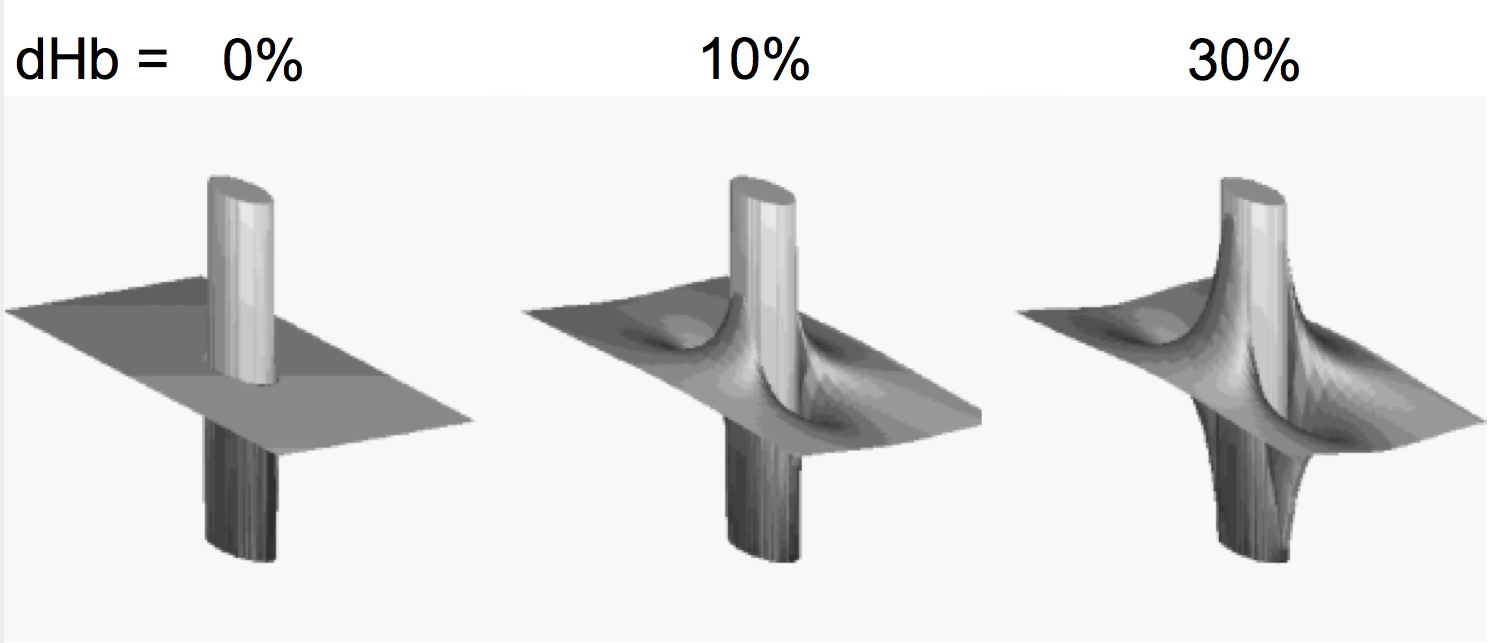
FIGURE 2: Magnetic field around a cylinder oriented perpendicularly to the external static field containing 0%, 10%, and 30% deoxyhemoglobin. The susceptibility between inside and outside the cylinder was taken to be the same at 0% deoxyhemoglobin. The field magnitude is represented as a three dimensional plot.
Outside the cylinder, the magnetic field is directly proportional to (rb/ r)2 where rb designates the cylinder radius, r is the distance from the point of interest to the center of the cylinder in the plane normal to the cylinder. Thus, the magnetic field perturbation induced by the susceptibility difference changes rapidly over a distance comparable to two or three times the cylinder radius; at a distance equal to the diameter of the cylinder from the cylinder center, the field is already down to 25% of its value at the cylinder boundary and close to what it would be if the blood vessel was not there at all.
What is of critical importance for the extravascular BOLD effect is that the magnetic field is inhomogeneous around dHb containing blood vessels. The magnitude of this inhomogeneity is proportional to the external magnetic field applied, and the magnetic susceptibility difference between inside and outside the blood vessel, which in turn depends on the amount of dHb present; the spatial extent of the inhomogeneity is about a diameter or so around the blood vessel. This implies that the resonance or precession frequency3 of spins varies over space in the voxel where there exists dHb containing blood vessels, i.e. capillaries, venules and veins.
In a GRE fMRI experiment, images are acquired after a delay TE in order to sensitize the image to magnetic field inhomogeneities. Intra-voxel magnetic field inhomogeneities lead to signal loss during the evolution period TE, because the precession frequencies of the spins are non-uniform within the voxel; magnetization vector of the voxel, which is the vector sum of all the magnetic moments associated with each water proton, will decrease with time as the different populations of these protons, encountering different magnetic fields, will have different precession frequencies. Therefore, they will not stay in phase. If there are many such vessels with different orientations and dimensions, this dephasing can be expressed as a random process obeying an exponential decay. In general, the time constant T2* characterizes the exponential decay of MR signals after they are excited. Thus, presence of dephasing due to dHb-containing blood vessels in a voxel contributes to the exponential decay and leads to a shorter T2*. If the dHb content is altered, the magnetic field gradients will also be altered (Figure 2), and consequently, the signal loss due to dephasing and the time constant T2* will also change.
Diffusion introduces a modification to the mechanism described above. The diffusion distances of water in tissue during the typical TE's (~20-50 ms) feasible in an fMRI experiment is such that the water molecule can sample all the magnetic field variations around small blood vessels, such as capillaries or small venules that immediately follow capillaries (e.g. Ogawa et al. 1993; Yablonskiy and Haacke 1994; Boxerman et al. 1995; Boxerman et al. 1995; Kennan et al. 1998; Kiselev and Posse 1999; Fujita 2001; Uludag et al. 2009). This random motion averages the magnetic field gradients around these small vessels, resulting in a substantially diminished BOLD effect. The averaging does not occur around larger blood vessels because the magnetic field gradients occur over longer distances, dictated by the blood vessel diameter. The diffusion mediated BOLD effect associated with the microvasculature is small but it increases supralinearly with magnetic fields up to ~7T (Uludag et al. 2009).
An alternative but rarely used approach for functional mapping utilizes spin-echoes (SE) where a single refocusing pulse, typically a 180° pulse, is inserted in the delay period TE between signal excitation and acquisition. The refocusing pulse leads to a rephasing of the dephasing that was induced by the magnetic field inhomogeneities within the voxel, thus recovering the signal loss that occurs due to dephasing. But the diffusion effects are not recovered since the path of the diffusing spins is not the same on the two sides of the refocusing pulse because diffusion is a random motion. Thus, in a SE fMRI experiment, the contribution of blood vessels beyond the microvasculature (e.g. with diameter ≥ 10 µm) to functional signals are attenuated significantly; instead, the microvascular contributions dominate. However, this diffusion-mediated effect associated with the microvasculature is small, as previously stated, accounting for the unpopularity of SE fMRI; but it increases supralinearly with magnetic field up to ~7T (Uludag et al. 2009) reaching robust and easily detectable levels at that field strength (Yacoub et al. 2003; Yacoub et al. 2005) that are, in fact, somewhat comparable to what one observes at 3T.
In a SE measurement, the amplitude of the spin-echo detected decays exponentially with a time constant T2. If the magnetic field within a voxel in the sample is completely homogeneous, then, for that voxel T2 = T2*. But even in the absence of deoxyhemoglobin this condition is rarely fulfilled. So, T2* ≤ T2 always. Signal decay in a GE experiment, characterized by the parameter T2* also contains the contribution of processes that contribute to T2. In fact, under most circumstances, one can simply write where the second term accounts for all other effects besides T2.
Diffusion mediated change in a SE amplitude in the presence of magnetic field inhomogeneities is actually not a true T2 effect because the effective T2 associated with this process depends on the TE itself. For very short TE's, diffusion induced motion of spins becomes small and recoverable under a refocusing pulse; this is not the case for longer TE values. In contrast, processes like dipole-dipole interactions between spins result in signal loss in a SE experiment that can be characterized with a constant T2 that is independent of the echo time TE. Nevertheless, in the fMRI world, people talk about T2 effects when referring to functional signal changes detected in a SE experiment. But we should really talk about an apparent T2 to remain cognizant of the fact that T2 is not just a constant independent of TE for the BOLD effect.
Intravascular Effects
In blood, hemoglobin is also compartmentalized within red blood cells. Therefore, when the deoxy form is present, there are field gradients around the red blood cells. However, because the dimensions of these gradients are very small compared to diffusion distances, the effect is averaged by diffusion, as it is for capillaries and small venules, and becomes a change in the apparent T2 only. This dynamic averaging also involves exchange across the red blood cell membrane which is highly permeable to water. Thus, the apparent T2 of blood changes when the content of deoxyhemoglobin is altered by elevated neuronal activity and this leads to a signal change in a T2 weighted image. This effect also comes into T2* weighted image because, as previously stated, all processes that contribute to T2 also contribute to T2*.
This change in blood apparent T2 (and consequently a signal intensity change in a T2 and T2* weighted image) will be present wherever and whenever the content of deoxyhemoglobin has changed; thus, it will be associated with both large and small blood vessels. This effect is substantial, even the dominant contribution to functional imaging signals at low magnetic fields such as 1.5 Tesla (van Zijl et al. 1998; Duong et al. 2003). It diminishes in importance at high fields because the T2* and T2 of blood decreases precipitously with increasing magnetic field magnitude and becomes much less than that of signals associated with tissue (Duong et al. 2003; Uludag et al. 2009); consequently, in an acquisition where the TE is set approximately equal to tissue T2* or T2 for GRE and SE fMRI, respectively, blood signals are significantly attenuated and are even diminished beyond detectability. At 3 Tesla, blood signals were shown to account for approximately 50% of the SE based fMRI signals. At 7 Tesla, the upper limit on these contributions is less than about 10% at TE values corresponding to tissue T2 (Duong et al. 2003).
inflow effects in bold-based fmri
During the hemodynamic response that supplies more blood to the area of increased activity in the brain, flow increases must also take place within the vascular tree supplying and draining the activated area. This vascular flow change can lead to signal alterations in large blood vessels in images intended to report on BOLD contrast (e.g. Menon et al. 1993; Duyn et al. 1994; Frahm et al. 1994; Kim et al. 1994; Segebarth et al. 1994). This is not because BOLD contrast itself contains a direct inflow effect; rather, image contrast may not be purely of BOLD origin because any repeated, slice-selective image is inherently flow sensitive if the signal within the slice does not attain full relaxation between consecutive signal excitations. In single slice studies, allowing full relaxation in between RF pulses eliminates this problem completely; however, this condition often is not satisfied in many studies since it leads to a loss in SNR per unit time. Consequently, such studies essentially obtain images of macrovascular flow rather than the much smaller BOLD changes. This problem was demonstrated with clarity by comparing presumably BOLD-based functional images with vessel images in two and three dimensions (Segebarth et al. 1994; Belle et al. 1995).
In a multi-slice experiment, even if the time between the acquisition of the same slice in an fMRI time series is compatible with full relaxation of spins in that slice, an inflow problem may still be present due to inter-slice effects. For example, blood experiencing an RF pulse in one particular slice will subsequently travel to other parts of the brain and, in turn, affect the intensity of signals from a slice sampled at a later time. The sensitivity to this problem will depend on the imaging sequence used, and how the different slices are sampled and oriented, since most macrovascular flow occurs along an inferior-superior direction in the human brain. Experimental evidence, however, indicates that the contribution of this type of inter-slice flow to BOLD-based multi-slice imaging is negligible (Howseman et al. 1999).
modeling of fmri signals
A complete modeling of stimulus- or task- induced fMRI signal changes must consider the aforedescribed extravascular and intravascular mechanisms as well as the numerous basal physiological parameters, such as blood volume, and blood oxygenation, and the changes induced in these parameters by alterations in brain activity. Such a comprehensive model was recently published (Uludag et al. 2009). This paper also presents a good review of what has been done previously in this area, and the interested reader is referred to it for an overview of all modeling efforts and relevant literature.
Figure 3 illustrates the calculated fractional signal change for a spin-echo fMRI experiment for macro and microvasculature from the Uludag et al. (2009) paper. The macrovascular plot presented was calculated for a blood vessel orthogonally oriented to the main (static) magnetic field, and thus represents an upper limit for the macrovascular contribution; this contribution would decreases precipitously when the orientation of the blood vessel deviates from orthogonal, and is absent when the blood vessel is completely and perfectly parallel to the external magnetic field in the voxel. For the microvasculature, the orientation does not come into play because there are so many such vessels of different orientations in a typical MRI voxel; so, an average of all orientations is taken.
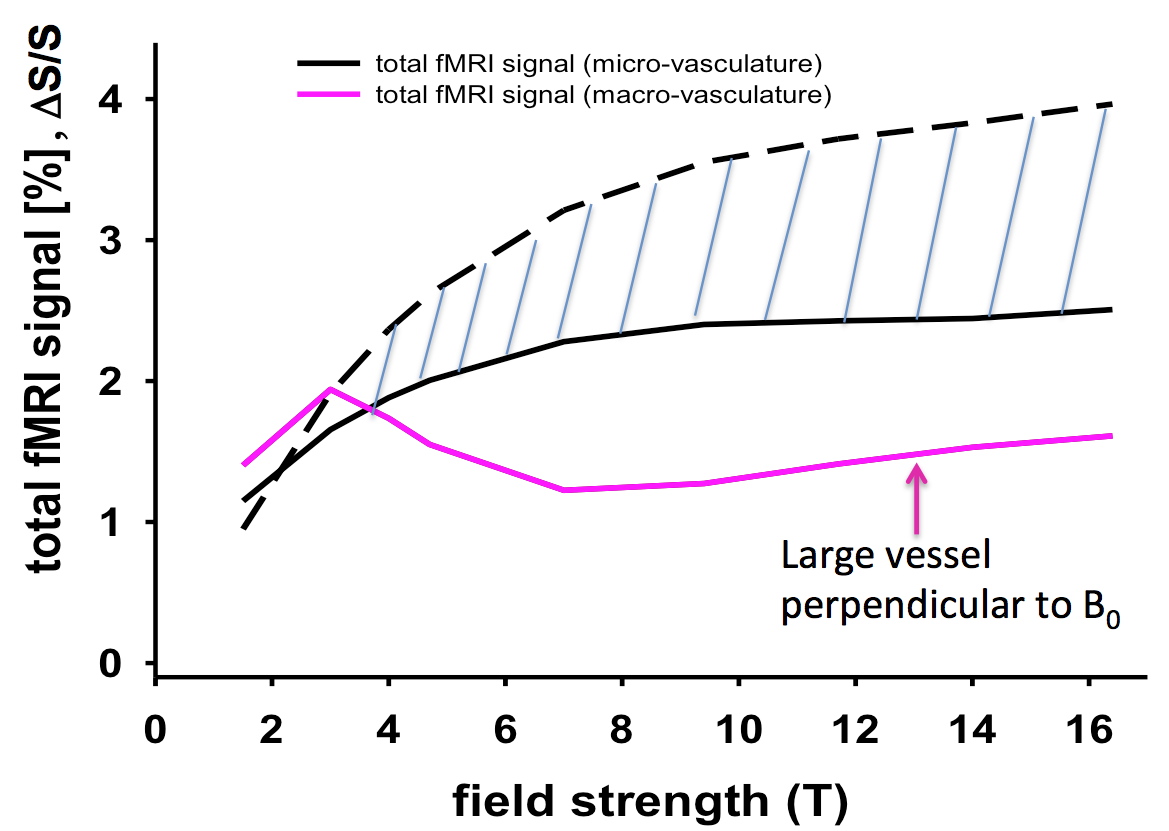
FIGURE 3: Simulation results for SE fMRI for TE= T2 as a function of field strength. Total fMRI signal (considering intravascular and extravascular effects) is shown in black for microvasculature assuming no stimulus induced CBV change (dashed line), and 16% microvascular CBV change. Most probable scenario is between these two extremes. Total fMRI signal for macrovasculature is shown in magenta for the extreme case of a vessel oriented perpendicularly to the static magnetic field, which causes the maximum effect. Microvascular CBV was taken to be 2.5% and was assumed to be composed of 20% arterioles (diameter = 16 µ), 40% capillaries (diameter = 5 µ), and 40% venules (diameter = 16 µ). Adapted from Uludag et al. 2009.
Figure 3 demonstrates the clear dominance of microvascular effects in a SE experiment and that this dominance increases with increasing magnetic field. There is some uncertainly as to what the microvascular contribution is to the SE fMRI signal; two different plots are given for it and they correspond to a condition where CBV changes accompanying neuronal activity alterations do or do not occur in the dHb containing microvasculature, the only CBV change that is relevant for the SE BOLD effect. While there are good estimates of CBV changes correlated with alterations in CBF, and hence with stimulus evoked activity (e.g. Grubb et al. 1974; Grubb et al. 1978; Ito et al. 2001), the measurements pertain to the total CBV associated with the entire vascular tree, from arteries to draining veins. Assuming that this total fractional CBV change to be applicable for all dHb containing vessels, including the dHb-containing microvasculature, represent one limit for the modeling results of SE fMRI presented in Figure 3 with the solid black line. It is likely, however, that CBV changes do not occur, or do not occur to the same extent, in all parts of the vasculature. In fact MR studies suggested that dHb containing blood vessels from capillaries to draining veins do not undergo CBV changes coupled to neuronal activity (Kim and Kim 2005; Kim et al. 2006) at all, in agreement with PET data that takes into account the different CBV components in in the modeling of radiotracer kinetics (Ito et al. 2005). This represents the other limit (i.e. no CBV change coupled to neuronal activity alteration in the microvasculature) illustrated with the dashed line in Figure 3. For GRE fMRI, large vessels always contribute to the fMRI mapping signals and always yield the largest effects. They cannot be avoided in GRE fMRI at any field strength. However, as the field magnitude increases, the relative contribution of the microvasculature increases as well. This is illustrated for the extravascular effect in Figure 4.
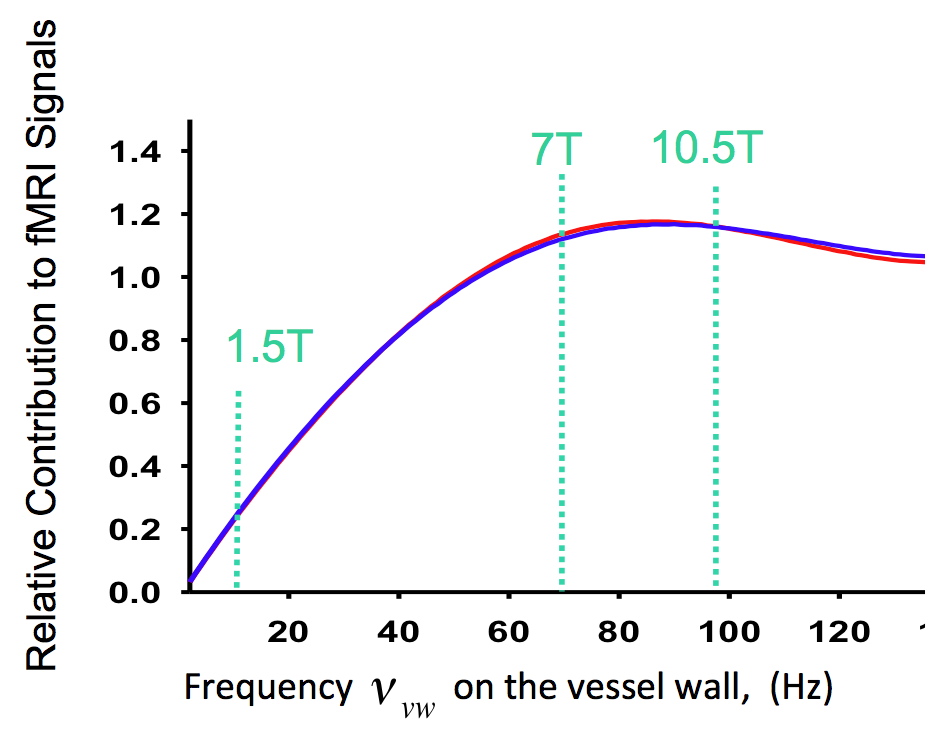
FIGURE 4: Relative contribution to T2* weighted GRE fMRI from capillaries vs. larger blood vessels (veins) as a function of the frequency on the vessel wall for a cylinder mimicking blood vessels. There are two curves displayed, in red and blue, representing the ratio of contributions from a 5 µ blood vessel relative to a 60 µ and to a 100 µ vessel, respectively. The two are virtually superimposable, since the contribution becomes independent of vessel diameter after about ~10 µ. The ratio is calculated for the same susceptibility difference between vessel interior and the surrounding tissue for both the 5 µ vessel and the 60 and 100 µ vessels. In vivo, this is not the case because a 5 µ vessel, which is a capillary, has a lower average deoxyhemoglobin content than the veins draining the capillary bed. Taking this into account would not change the overall picture but would shift this curve to the right. Note that the horizontal axis is dependent on the product of the deoxyhemoglobin content and the external magnetic field applied. Fixing the deoxyhemoglobin content at 40% yields the frequency on the vessel wall corresponding to magnetic fields of 1.5, 7 and 10.5 Tesla, indicated by the vertical dashed lines. Adapted from Uludag et al., 2009.
SPATIAL SPECIFICITY OF BOLD fMRI
Although the neuro- and cognitive- science communities have embraced fMRI with exuberance, caution must be exercised in quantitatively using fMRI data because fMRI maps are based on secondary metabolic and hemodynamic events that follow neuronal activity, and not the electrical activity or the neurotransmission directly. One of the most important issues is the spatial specificity of the fMRI maps, i.e. how accurate are the maps generated by fMRI compared to actual sites of neuronal activity (e.g., Ugurbil et al. 2003; Ugurbil et al. 2003).
Neuronal organizations that respond to a highly reduced attribute of an input and perform elementary computations are known to exist in the millimeter to submillimeter spatial scale both tangentially on the cortical surface and across the cortical laminae. Columnar clustering is likely to be a fundamental organizational principle in the brain. Based on monkey electrophysiology studies, clustering analogous to the well-recognized columns in the early visual areas has been proposed for higher order visual areas such as the middle temporal (MT) for direction of motion (Albright 1984; Albright et al. 1984), and inferio-temporal (IT) cortex for face and object recognition (Fujita et al. 1992; Wang et al. 1996). Imaging such organizations, however, requires submillimeter specificity of mapping signals and sufficiently high image SNR to meet the spatial resolution demands in image acquisition. This is an important technical challenge in fMRI. This challenge is illustrated by the fact that the point spread function (PSF) of GRE fMRI, the most commonly used form of fMRI, was measured to ~3.5 mm at 1.5 and 3 Tesla (Engel et al. 1997; Parkes et al. 2005). When areas of the brain containing draining veins were avoided, the PSF upper limit was measured to be 2 mm at 7 Tesla (Shmuel et al. 2007). These numbers are significantly larger than the spatial scale of cortical columns or the different neuronal layers across the cortical thickness.
In the two decades since the introduction of fMRI, functional mapping with columnar and laminar resolution seems to have been largely uninteresting in the human cognition community. In part, this must be due to the difficulty of reaching this level of resolution with any form of MR imaging because of signal-to-noise limitations. The fact that most cognitive studies performed on the human brain have not yet reached a mechanistic formulation at this elementary level must have also played a role. Nevertheless, at CMRR we decided to pursue the question of columnar or laminar functional mapping immediately after the introduction of fMRI. Particularly influential for us was the work by our colleague Apostolos Georgopoulos using electrophysiology in non-human primates. In a series of ground-breaking studies published in Science (Georgopoulos et al. 1986; Georgopoulos and Grillner 1989; Georgopoulos et al. 1989; Georgopoulos et al. 1992; Georgopoulos et al. 1993), Georgopoulos had demonstrated the presence of directionally tuned cells in the primary motor cortex and introduced the concept of the population vector (Georgopoulos et al. 1986); when individual, directionally-tuned, cells were represented as vectors according to changes in their activity during a movement of the arm, the construct that is the vector sum of all these cell vectors (population vector) was in a direction congruent with the direction of movement. This is a forward, predictive, and mechanistic model linking neuronal activity with behavior. It has become relatively common in electrophysiology experiments. To construct such forward models with fMRI at this elementary level, however, most likely requires relatively high resolution (at or approaching columnar resolution) and spatially specific (to sites of neuronal activity) imaging that can provide numerous functionally distinct and independent voxels. Achieving this type of capability provided the motivation for the steady effort at CMRR towards attaining improved accuracy of functional imaging signals. This effort is largely responsible for the plethora of animal model studies exploring the fidelity of functional signals to sites of altered neuronal activity (e.g. Duong et al. 2000; Duong et al. 2001; Harel et al. 2002; Harel et al. 2006) (Lee et al. 1999; Duong et al. 2000; Silva et al. 2000; Lee et al. 2001; Lee et al. 2002; Kayser et al. 2004; Kim et al. 2004; Zhao et al. 2006) and development of ultrahigh field magnetic resonance imaging (e.g. Ugurbil et al. 1999; Ugurbil et al. 2000; Ugurbil et al. 2003). In this effort, I regard one of our papers (Duong et al. 2001) as critically important since it demonstrated for the first time that blood flow is regulated at the level of orientation columns in the cat visual cortex (discussed further in the next section). Parallel to the animal model studies, the development of 7 Tesla for human MRI, which was first accomplished in CMRR, was also largely propelled with the drive to attain high-resolution functional mapping with high spatial fidelity to sites of neuronal activity.
Ultimately, these efforts led to robust imaging of ocular dominance columns at 7 Tesla (Yacoub et al. 2007) (after earlier results at 4 Tesla by us (Menon et al. 1997) and others (Cheng et al. 2001; Goodyear and Menon 2001)), the first time imaging of orientation columns in the human brain (Yacoub et al. 2008), and the axis of motion selective features in human area MT (Zimmermann et al. 2011). The MT work also demonstrated that these organizations could be mapped with laminar resolution, supporting our other 7 Tesla work on imaging cognitive processing at different layers of the cortex in V1 (Olman et al. 2012). Figure 5 illustrates the functional images obtained in the human MT on either three flattened layers at different depths or in planes that run perpendicular to the cortical surface.
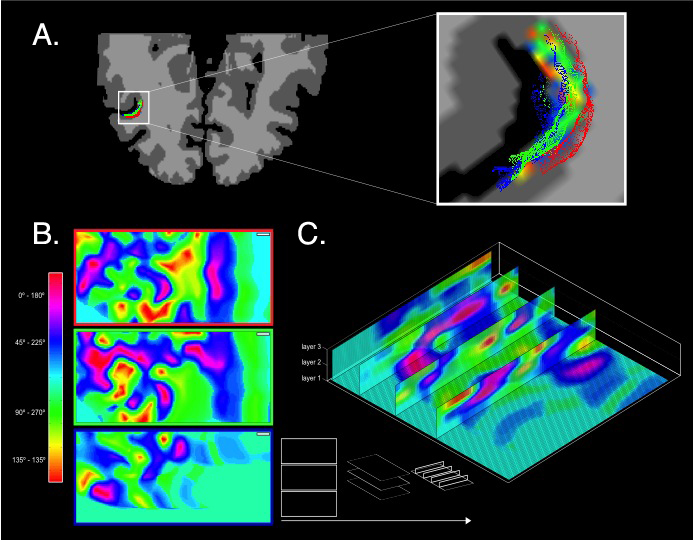
FIGURE 5: Axis of motion columnar mapping in one subject. (a) Results of MT localization are projected onto the cortical reconstruction of the subjects left hemisphere (neurological convention). High-resolution cortical grid sampling is performed. Zoomed-in view to the subjects STS shows overlaid streamlines at three relative cortical depths. (b) Results of the high resolution cortical grid sampling for the motion direction experiment showing columnar organization of axis of motion features in three sampled layers Top layer may be degraded by residual contribution from pial vessels (c) Representation of the high resolution cortical grid sampling showing four three-dimensional vertical slices through the sampled cortical layers depicting the consistency of cortical columns tangential to the surface. Adapted from Zimmermann et al., 2011.
A previously unknown columnar organization of domains that respond preferentially to either low or high temporal frequency was imaged recently at 4T (Sun et al. 2007). In collaboration with CMRR, Georgopoulos also demonstrated an fMRI based population vector construct in the human parietal cortex with 4 and subsequently 7 Tesla fMRI, predicting behavior in a maze task which had a direction component embedded in it (Gourtzelidis et al. 2005; Jerde et al. 2008) (Figure 6); in these studies, the fMRI data were shown to provided virtually identical results to electrophysiology-based measurements in the trained nonhuman primates (Figure 6) that were performed independently (Crowe et al. 2004). It was also demonstrated in these experiments that 7T provided a significantly larger number of independent voxels that were identified as being uniquely tuned (Jerde et al. 2008). These are the first fMRI examples of encoding modeling that are currently generating significant interest (Naselaris et al. 2011).
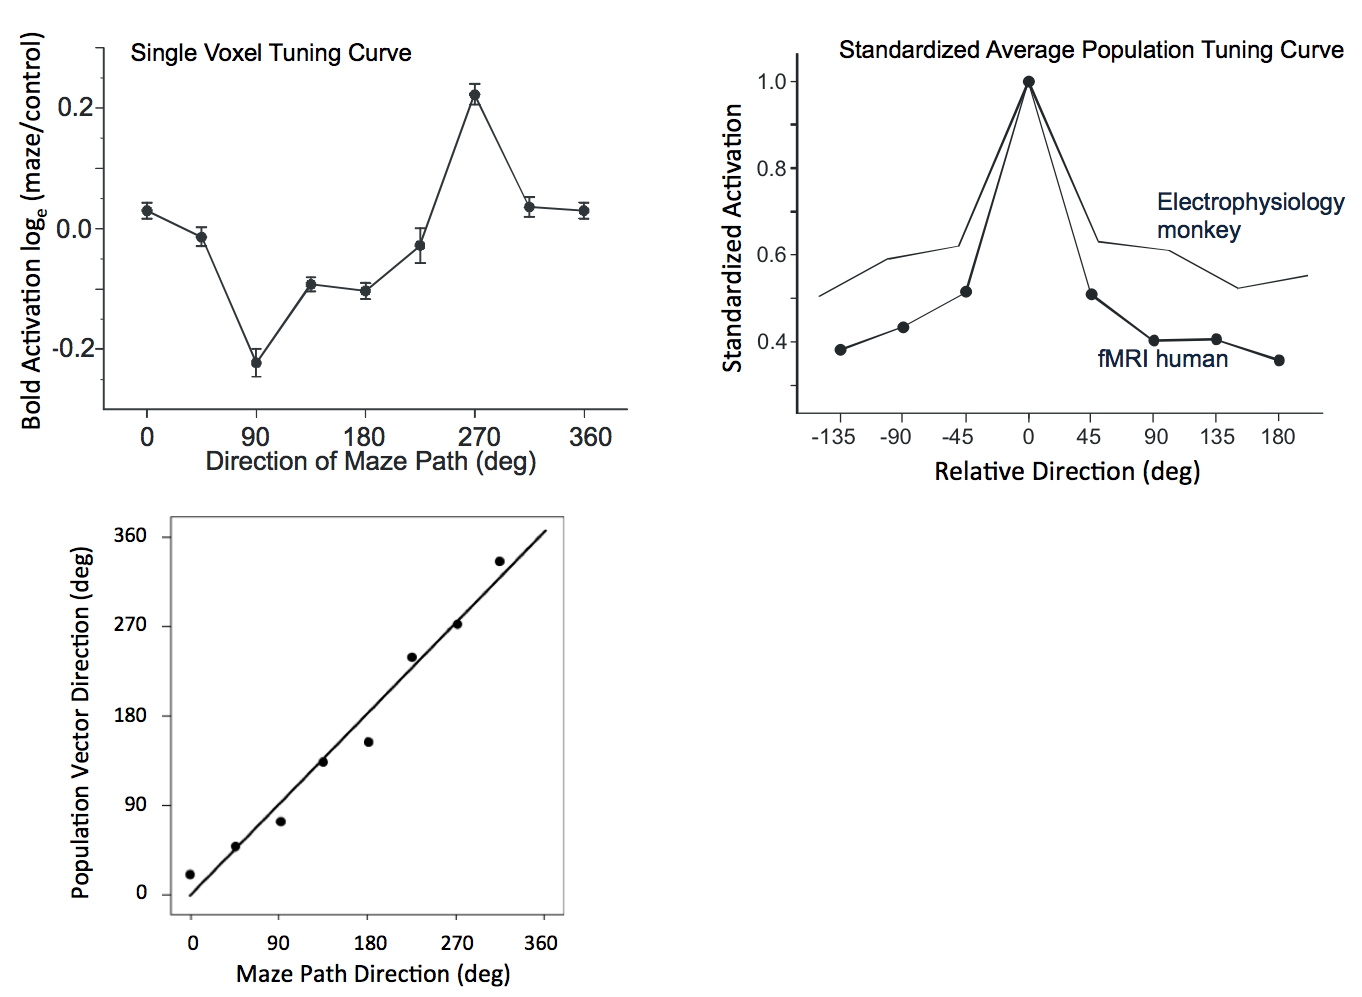
FIGURE 6: Upper figure (left): Directional tuning curve for voxels exhibiting tuning for 270 degree maze exit. Upper figure (right): Standardized population tuning curve (see Gourtzelidis et al., 2005) for voxels and cells. The cell tuning curve is from Fig. 6 in (Crowe et al., 2004) and was obtained with electrophysiological recordings in trained non-human primates. Lower figure: The direction of the population vector computed from all the data from the human experiments plotted against the corresponding direction of the maze path. Adapted from Gourtzelidis et al., 2005.
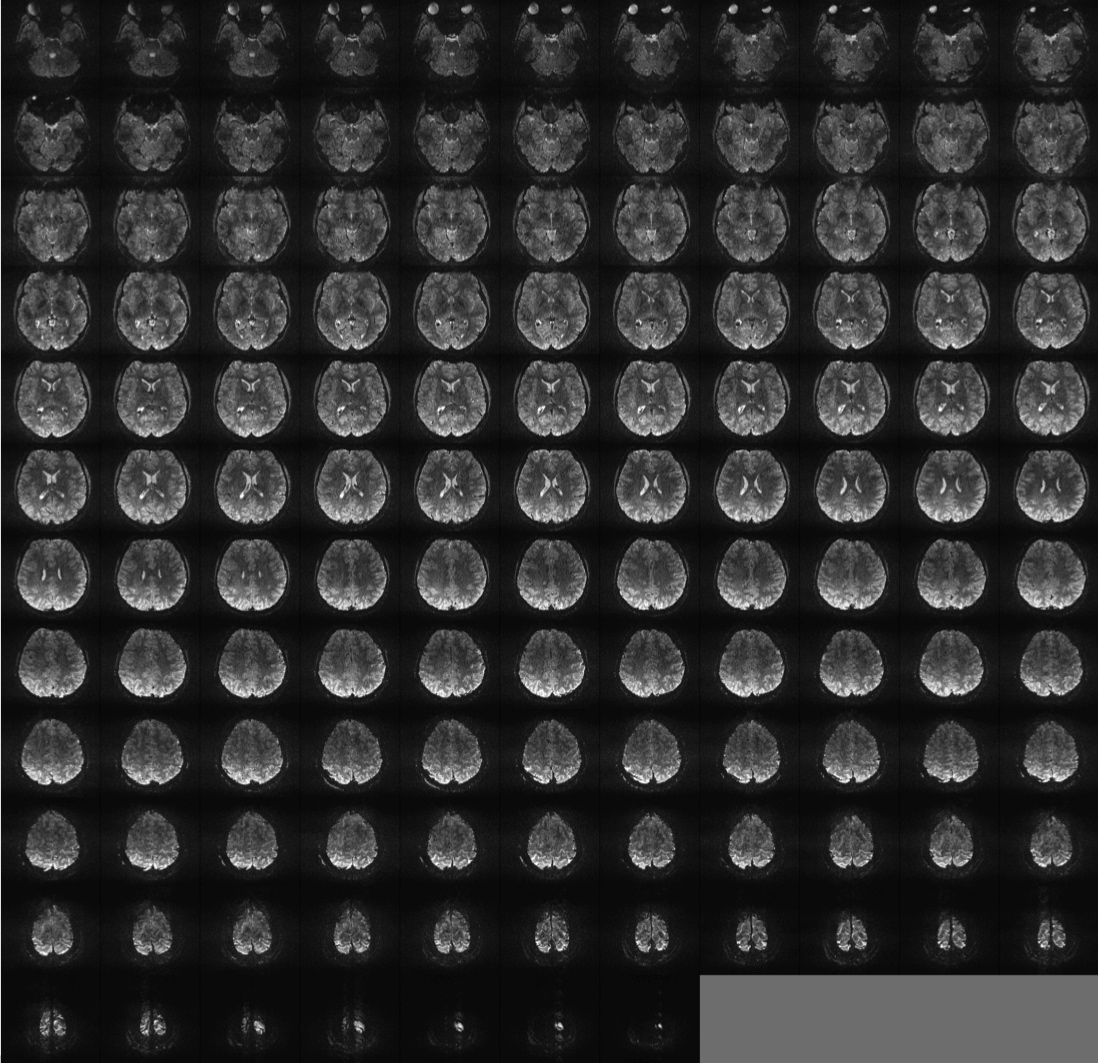
FIGURE 7: Whole brain EPI images at 7 Tesla: 0.75 mm isotropic Echo spacing 0.67 ms, 256 x 256 ,parallel imaging with reduction factor 4. Partial Fourier = 6/8 TE = 20 msec, 128 slices TR = 6 s, single image. Data generated in CMRR, University of Minnesota by Yacoub et al.
However, I regard these accomplishments as a prelude to a new era where whole brain high-resolution fMRI, at or approaching columnar and layer resolution is feasible at 7T. This capability has been used recently to perform 1 mm isotropic resolution whole brain resting state fMRI (De Martino et al. 2011). Figure 7 illustrates 0.75 mm isotropic whole brain single-shot EPI images acquired at 7T; these are excellent quality EPI images, better than even what most people use at much lower field strengths where EPI is easier to execute. They also have sufficient SNR to serve in an fMRI study. I believe 0.5 mm isotropic will be attainable when 7 Tesla systems with more than 32 receive channels will become available. Numerous technological and engineering solutions had to be realized at 7 Tesla before such imaging capability became feasible. These include parallel imaging to accelerate along the phase encoding direction (Pruessmann et al. 1999; Sodickson et al. 1999; Griswold et al. 2002) (probably the most important development for ultrahigh field imaging using single-shot EPI, which is the workhorse of fMRI), slice accelerated whole brain functional imaging (Moeller et al. 2008; Feinberg et al. 2010; Moeller et al. 2010), and parallel multichannel transmission (e.g. Adriany et al. 2005; Van de Moortele et al. 2005; Vaughan et al. 2006; Metzger et al. 2008; Setsompop et al. 2008; Setsompop et al. 2008; Setsompop et al. 2008; Setsompop et al. 2009); in fMRI, accompanying anatomical images are also of great importance. Yet at 7 Tesla, obtaining good anatomical images without large intensity variations that obscure tissue contrast and/or preclude automated gray-white matter segmentation was initially difficult. This problem was solved with the introduction of biased field correction methods in anatomical imaging (e.g. Duyn et al. 2007; Van de Moortele et al. 2009). Coupled with improved anatomical contrast (e.g. Duyn et al. 2007; Rooney et al. 2007; Budde et al. 2011; Henry et al. 2011) now available, ultrahigh fields provide superb anatomical images that can accompany functional images at these field strengths.
Specificity of Perfusion Changes coupled to neuronal activity
In fMRI, the degradation of spatial specificity might arise from imprecise spatial-coupling between neuronal activity and the physiological and metabolic events that ultimately yield the functional maps. The dominant physiological change induced by alteration in the neuronal activity relevant for fMRI is CBF change. There is no a priori requirement that control of CBF spatially match functional organizations as long as CBF change includes the functional territory responsible for invoking the altered CBF state. In fact, at the time of the introduction of fMRI, prevailing concepts suggested that CBF control far exceeds the territorial boundaries of columnar organizations; in other words, the brain watered the entire garden for the sake of a single thirsty flower (Malonek and Grinvald 1996). We examined this question again using newly developed MR methods (Duong et al. 2001) and showed that in fact, the brain waters the thirsty flower while it sprinkles an extensive region around it.
Images of blood flow and blood flow changes associated with increased neuronal activity can be obtained using arterial spin labeling (ASL) techniques that utilize the water protons in the blood as an endogenous transient tag. These methods rely on either continuous (e.g. Detre et al. 1992; Zhang et al. 1993; Detre et al. 1994) or dynamic, i.e. modulated versions of continuous (Barbier et al. 1999; Barbier et al. 2001) or pulsed (e.g. Edelman et al. 1994; Kim 1995; Wong et al. 1998) tagging approaches. Efficiency of some of these methods was recently evaluated quantitatively (Pohmann et al. 2010). These ASL techniques can be tuned to be selectively sensitive to capillary/tissue level flow, and the detection of blood flow or blood flow changes in large blood vessels can be minimized. Such maps report on water delivery to the capillary bed and, by exchange across the capillary wall, to surrounding tissue, i.e. perfusion.
In these MR techniques, a perturbation (the label) is induced in the population of hydrogen nuclei (spins) of water in blood, outside the region of interest; this label is monitored as it shows up in the tissue in the region of interest after a delay (the tagging time) that is long enough to permit arrival into the capillaries and the surrounding tissue but not long enough to reach thermal equilibrium. In this case, the amount of label detected in the tissue in the region of interest is proportional to blood flow, and increases with elevated neuronal activity. Since the arterial side is permeated with fresh blood significantly faster relative to the tissue, the time to reach the equilibrium state in the large arteries versus the tissue is different. Thus, long tagging times (e.g. ~1.5 to~2 s) (Tsekos et al. 1998) eliminate the arterial component from perfusion images. The long tagging times, however, may lead to the tagged spins appearing in the venous side, thus leading to false activation in the draining veins. At high magnetic fields, the T2 and T2* of venous blood is very short (Thulborn et al. 1982; Lee et al. 1999) so that this effect can be selectively eliminated by a brief delay after excitations of spins but before image acquisition. Accordingly, perfusion-based fMRI maps have been shown to yield accurate images that co-localize with Mn+2 uptake (Duong et al. 2000), a marker of calcium dependent synaptic activity (Lin and Koretsky 1997).
When potential large vessel contributions are suppressed with appropriate choice of imaging parameters, perfusion-based fMRI can be used to examine the critical physiological question related to specificity of blood flow increases. A specific question that can be asked is if perfusion changes are confined accurately to the region of increased neuronal activity in the spatial scale of columnar organizations?
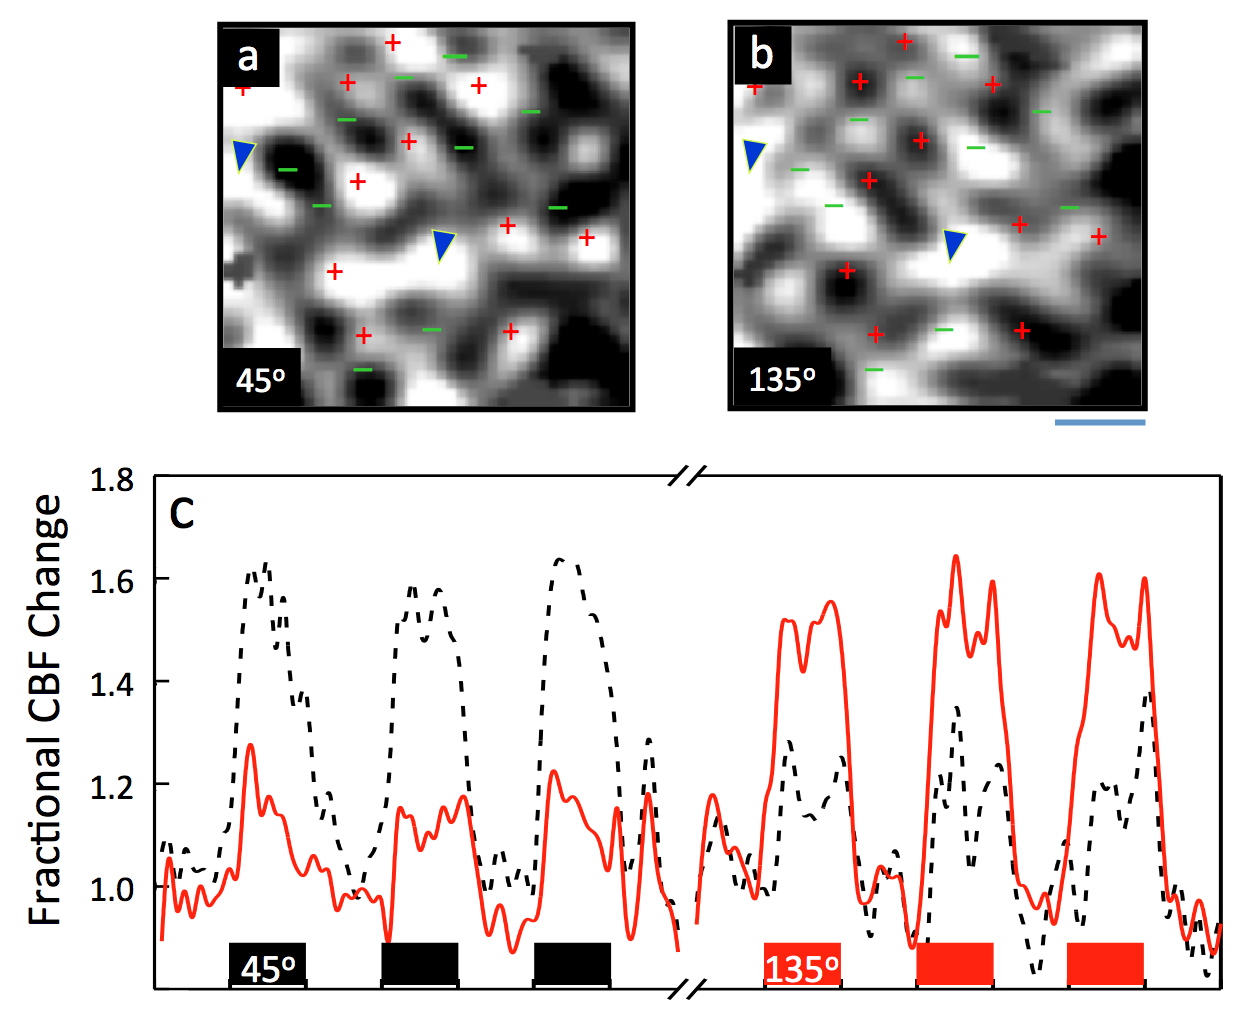
FIGURE 8: Activation maps of two orthogonal iso-orientation domains in the cat visual cortex obtained separately with perfusion based functional imaging mapping. Panel a and b, show perfusion based images obtained with two orthogonal orientations (45 and 135 degree gratings), demonstrating their complementarity. Each map was acquired as a single condition map where the grating of one orientation was either moving back and forth (activation condition) or static (control condition). Bottom trace (Panel c) shows the cerebral blood flow (CBF) response at the tissue level (i.e. perfusion) in all the voxels identified as activated either by the 45 degree or 135 degree grating for the two orthogonal stimulations. All voxels identified as activated for 45 degree orientation display a large perfusion increase during stimulation by this orientation gratings and show a smaller but detectable perfusion increase in response to the 135 degree gratings. The converse is observed for the voxels identified as activated for 135° gratings. A marked perfusion increase (~55-60 %) following 45° or 135° stimulus was observed in the regions tuned to these orientations, while the stimulation with the orthogonal orientation lead to a 3.3± 0.6 fold smaller perfusion increase in the same region. Adapted from reference Duong et al. 2001.
Such a study was performed using the iso-orientation columns in the cat visual system (Duong et al. 2001) using single condition mapping (stimulus vs. a non-stimulus control state); the results demonstrated that while perfusion increases that follow neuronal activation were not perfectly localized at the iso-orientation column level, the difference between active and neighboring inactive columns was large and permitted single condition mapping (Figure 8). In other words, as previously stated, the brain was found to literally water the thirsty flower while sprinkling an extensive region around it. To accomplish this, there must exist regulation of blood flow control at the submillimeter (~300 to 400 µm) scale. These data were also used to calculate a point-spread function for the CBF control in the cat cortex; this PSF, at full width at half-maximum (FWHM), was 470 µm under single-stimulus condition without differential subtraction.
It is important to emphasize that the perfusion based images of the orientation columns in the cat cortex (Duong et al. 2001) described above was obtained under single condition as opposed to differential mapping. Differential mapping refers to functional images obtained by effectively subtracting two analogous but orthogonal activation states; this approach is assumed to generate functional maps with high fidelity to the territory of altered neuronal activity because spatially non-specific mapping signals are assumed to be common to the orthogonal activation conditions. This assumption appears to be incorrect at the level of cortical columns (Shmuel et al. 2010). Nevertheless, differential mapping is expected to have better spatial accuracy than signal condition maps, which do not employ any strategy to suppress spatially inaccurate mapping signals. Mapping ocular dominance columns by stimulating one eye vs. the other in an alternating fashion is differential mapping. Stimulating one eye and using a dark state as the control would correspond to single condition mapping. Phase encoded mapping using an activation paradigm that cycles through several different possible stimulations, as employed in the visual system (e.g. Sereno et al. 1995; DeYoe et al. 1996; Engel et al. 1997), is also a kind of differential mapping because it would suppress common, non-modulating components.
Thus, the ability to obtain single-condition maps of orientation domains by perfusion imaging (Duong et al. 2001) was a fundamentally important result for brain physiology and functional mapping with magnetic resonance because it demonstrated for the first time that CBF changes are regulated even at the level of capillaries in addition to being subject to upstream control at the level or arterioles and arteries. This conclusion was initially considered to be in conflict with results from optical imaging techniques that report on CBV, which is assumed to be correlated with CBF in space and magnitude. However, there is an important difference between optical imaging and MR perfusion imaging data. Namely, the MR methods can be set to eliminate, in the image acquisition phase, the confounding problem coming from large vessels. When the origin of the functional mapping signals is restricted to the spatially accurate capillary/tissue level by the physics of the MR acquisition method, accurate columnar activation is detected. However, the optical methods do not have this selective tuning capability and report on all CBV changes; thus, they can in fact be dominated by large vessel effects. Recent optical imaging studies conducted subsequent to the perfusion mapping of iso-orientation columns by perfusion fMRI, have confirmed this fundamental difference and demonstrated that when large vessel effects are taken out, CBV based optical imaging techniques also yield columnar level mapping signals (e.g. Harrison et al. 2002; Sheth et al. 2003; Vanzetta et al. 2004). Subsequently, CBV based fMRI studies, conducted using the extravascular contrast agent MION, have also demonstrated single condition columnar resolution (Zhao et al. 2005; Harel et al. 2006); these MION based fMRI studies, with their superior sensitivity, further revealed that laminar activity can be spatially resolved and that the larger intralaminar signal changes correspond to cortical layer 4 (Harel et al. 2006). These observations further confirm that capillary level control of blood flow and volume in the brain exists and modulates activation-induced alterations in these physiological parameters at the columnar and laminar level.
Spatial Accuracy of Magnetic Resonance Signals in Functional Mapping
Although the spatial fidelity of coupling between neuronal activity and the physiological and metabolic events that ultimately yield the functional images contain sufficient precision to map columnar structures, there is another potential source of degradation of spatial accuracy, which has been already alluded to; namely, the coupling between the MRI signals and the physiologic changes that occur. This coupling in turn depends strongly on magnetic field and the pulse sequence used. Many of the issues that exist with respect to this question were already mentioned in discussing the BOLD mechanism. They are revisited and summarized here, organized in a more concise form.
All vessel types containing dHb, ranging from capillaries to large veins contributed to the T2* GRE fMRI, the overwhelmingly dominant techniques used in fMRI. However, as previously mentioned, the large vein contribution dominates GRE fMRI at all magnetic field strengths. Thus, GRE fMRI suffers from inaccuracies in functional mapping because of large vessel contributions. Often one is concerned with the large blood vessels on the pial surface of the brain. Deoxyhemoglobin changes clearly must occur first at the location where stimulus or task induced neuronal activity changes take place; however, due to blood flow, these dHb changes must propagate down the vascular tree to draining veins on the pial surface. At some point in the vascular tree, the functionally induced changes will be diluted by blood that is pooled from other unaffected regions by the task or the stimulus, and hence will disappear from the functional map. But, before this dilution occurs, functional signals associated with draining veins will be detected; that this represents a major confound was realized and documented as early as in 1993 (Menon et al. 1993; Kim et al. 1994) and was recently further reemphasized (Polimeni et al. 2010). GRE fMRI studies would also have a strong contribution from ~50 to ~100 µ intracortical veins that run perpendicular to the cortical surface and drain the different layers. These are the veins that were visualized in the original BOLD imaging work conducted in rats (Ogawa and Lee 1990); they can also be seen in very high-resolution human brain images with high T2* or phase contrast (e.g. Vaughan et al. 2006; Budde et al. 2011).
The GRE BOLD effect comes from both extravascular and intravascular (blood) sources. The blood contribution to fMRI signals can be the dominant source of functional maps at lower fields. This blood effect occurs at all levels of the vasculature. Its presence in capillaries and small venules is not a problem for spatial specificity; however, the functional signals associated with blood in large veins degrade the fidelity between regions of altered neuronal activity and the fMRI maps. This confound is diminished at ultrahigh fields as blood T2* decreases (Duong et al. 2003; Uludag et al. 2009) and becomes much shorter than tissue values of this parameter. Consequently, in a typical fMRI acquisition where echo time TE is set approximately equal to tissue T2*, blood contribution to the image can be significantly reduced or even absent with increasing magnetic field strength beyond 3 Tesla (Duong et al. 2003). Hence, at ultrahigh fields such as 7 Tesla or higher, the intravascular blood effect, one of the major sources of inaccurate functional signals, is suppressed or even eliminated.
The extravascular BOLD effect for large vessels persists at all field strengths and even increases with increasing field magnitude (Uludag et al. 2009); hence, it continues to be a source of inaccurate functional mapping signals in GRE fMRI. However, the microvascular contributions also get significantly larger at the ultrahigh fields and become comparable to the large vessel effects (Yacoub et al. 2001; Yacoub et al. 2005), enabling accurate mapping that would be difficult to achieve at lower magnetic fields. This relative microvascular gain was demonstrated in a 4T-7T comparison (Yacoub et al. 2001) and was utilized early in the history of 7T fMRI studies to reveal the tonotopic organization of the human auditory cortex for the first time (Formisano et al. 2003), at a time when attempts at studying this organization at lower fields had failed to produce convincing data. Similarly, fine-scale single-digit activations in subdivisions of the human primary somatosensory cortex (SI) in individual subjects was accomplished recently using GRE fMRI at 7T (Stringer et al. 2011). Recently, the presence of this microvascular contribution at 7T was relied upon when it was demonstrated that in high resolution 7T fMRI studies, stripping away the outer cortical layers where the pial vein contribution is dominant and looking into deeper layers of the cortex (Polimeni et al. 2010) yielded more accurate functional maps; without the presence of the microvascular contribution independent of and in addition to the large vessel contribution on the surface, this strategy would not have worked with GE fMRI.
The spatial inaccuracies introduced in functional mapping due to the large vessel confound present in GRE fMRI have been quantified experimentally in several ways. It was rigorously demonstrated that the GRE fMRI method fails to generate single-condition functional images of iso-orientation domains in the cat cortex (Duong et al. 2000; Kim et al. 2000) at 4.7 Tesla; the images of two orthogonal stimulation conditions were not complementary, as would be expected; rather, the highest activity was associated with a large draining vein, the sagittal sinus for the two orthogonal conditions. Simultaneous multiple site single unit recordings and fMRI studies on the same animal indicated that the limit of spatial specificity of GRE fMRI was in the 2 to 3 mm range for single-condition maps (Toth et al. 2001; Ugurbil et al. 2003). At 1.5 and 3 Tesla human brain studies, the full width at half maximum (FWHM) of the point spread function (PSF) for GRE fMRI was estimated to be 3.5 mm (Engel et al. 1997) and 3.9 mm (Parkes et al. 2005), respectively. In contrast, at 7 Tesla, the PSF at FWHM was measured to be ~2 mm or less in the human brain in regions devoid of the large veins visible in the image (Shmuel et al. 2007), demonstrating advantages of the ultrahigh field strength.
The large vessel effects that persist in GRE fMRI even at ultrahigh fields can be suppressed with spin echo based fMRI at ultrahigh but not at low magnetic fields. As previously discussed, SE fMRI responds to apparent T2 changes both in the extravascular space around microvasculature (capillaries and small post-capillary venules) and in blood itself (van Zijl et al. 1998; Ugurbil et al. 1999; Ugurbil et al. 2000; Uludag et al. 2009). The spatially inaccurate intravascular effects in veins are suppressed at ultrahigh fields because, the apparent T2 of venous blood decreases precipitously with increasing magnetic field magnitude (see Duong et al. 2003; Uludag et al. 2009 and references therein); it is diminished from ~180 ms at 1.5 Tesla (Barth and Moser 1997) to ~6 ms at 9.4 Tesla (Lee et al. 1999), significantly smaller than brain tissue T2; thus, at TE values that correspond approximately to gray matter T2, which would be optimal for detection of functional mapping signals associated with parenchyma at such field strengths, the blood signal would be significantly diminished, and even undetectable. At 3T, ~50% of the SE fMRI signals were shown to arise from blood (Norris et al. 2002). But at 7T, the blood contribution was estimated to be less than 10% at echo times matching gray matter T2 (Duong et al. 2003). Consequently, at very high fields such as 7 Tesla or higher, the functionally non-specific blood component as well as the extravascular BOLD effect associated with veins are suppressed in SE studies (Duong et al. 2003; Yacoub et al. 2003; Uludag et al. 2009). Residual large vessel effects are still expected because the extravascular BOLD effect with large blood vessels is not exactly zero in SE fMRI; rather it is small and significantly less than effects associated with microvasculature (Uludag et al. 2009). This is the reason why SE fMRI techniques at ultrahigh fields yield robust columnar level mapping, providing maps that are uninterrupted by large vessel contributions (Yacoub et al. 2008).
HIGH RESOLUTION WHOLE BRAIN fMRI
The advantages of high and ultrahigh field fMRI have largely been exploited in applications where a subsection of the brain, such as the primary visual cortex (e.g. Yacoub et al. 2007; Yacoub et al. 2008; Olman et al. 2010) or the auditory cortex (e.g. Formisano et al. 2003) was studied using field of view restriction. Ultimately, however, we need to cover the entire brain in high resolution. Only recently, significant progress has been made in tackling the difficulties inherent in obtaining rapid whole brain coverage at 7 Tesla using techniques like EPI, the predominant method employed in fMRI. EPI is challenged by the shorter T2* and increased magnetic field inhomogeneities at high fields. This difficulty is amplified with higher resolution as the EPI echo train length is elongated commensurately with resolution. Segmentation has been used in EPI to reduce the echo train length (McKinnon 1993; Feinberg and Oshio 1994; Wielopolski et al. 1995); however, in fMRI, k-space coverage with multishot techniques suffer from significantly increased sensitivity to temporal fluctuations induced by physiological processes and motion (Hu and Kim 1994; Hu et al. 1995; Moeller et al. 2006; van der Zwaag et al. 2011). These temporal instabilities can be minimized by post-processing strategies in multishot as well as in single shot techniques (e.g. Hu and Kim 1994; Hu et al. 1995; Mitra et al. 1995; Biswal et al. 1996; Ogawa et al. 1996; Mitra et al. 1997; Mitra et al. 1997; Mitra and Pesaran 1999; Glover et al. 2000; Pfeuffer et al. 2002; Van De Moortele et al. 2002). However, such strategies require intrinsically good SNR and, in some cases, rapid image acquisition so as to capture these temporal fluctuations accurately.
Of course, high resolution whole brain coverage necessarily increase the volume acquisition times (TR); using segmented, multi-shot approaches for a single slice increases this time further, leading to prolonged times for collecting sufficient data in an fMRI time series. With the advent of parallel imaging methods, which were discussed previously, the use of partial Fourier sampling (Feinberg et al. 1986), and improved gradient performance, many of the aforementioned technical limitations at high fields have been significantly alleviated. Using these advances, an example of what is feasible at 7 Tesla with GRE EPI is shown in Figure 7; these were images obtained with 0.75 mm isotropic resolution using a reduction factor, R, of 4 (i.e. 4 fold undersampling of the k space, or equivalently, 4 fold reduction in FOV, leading, in this case, to 4 fold maximum aliasing). Despite this, to date only a few whole-brain applications have been presented at ultrahigh fields and have mostly employed large slices, inter-slice gaps or have sacrificed temporal resolution (e.g. Bianciardi et al. 2009; Bianciardi et al. 2009; Bianciardi et al. 2009; Poser and Norris 2009; van der Zwaag et al. 2009; van der Zwaag et al. 2009; Poser et al. 2010), thus not fully exploiting the full benefit of ultrahigh field fMRI.
Although parallel imaging and partial Fourier sampling reduce the number of phase encoding steps for spatial encoding, and, consequently the echo train length after a single RF pulse, they do not necessarily reduce whole brain image acquisition times significantly in many applications. This is because a physiological contrast preparation period must precede the spatial encoding period for each slice and this contrast preparation period can equal or exceed the time employed for the spatial encoding in the EPI echo train. 3D echo volume (EVI) (Mansfield et al. 1994) avoids the repetition of the contrast encoding time by following a single contrast preparation period with subsequent 3D volume coverage in a single echo train. However, this approach has limitations in spatial resolution and image quality due to longer echo trains needed to fully encode the volumetric spatial information in the relatively short acquisition period dictated by T2*, especially at high fields; the consequence is distortions and blurring on two of the 3D image axes, as well as a loss in SNR. Multi-shot (segmented with multiple excitation) 3D EPI approaches that have produced high quality images (e.g. Wielopolski et al. 1995; Poser et al. 2010) overcome this limitation; however, in order to achieve very rapid coverage of the whole brain, high parallel imaging reduction factors must be employed in the two orthogonal phase encoding dimensions in the 3D acquisition, leading to significant SNR losses due to the omitted phase encoding steps; these approaches also suffer from increased temporal fluctuations inherent in multishot techniques as discussed above. Echo shifting approaches, PRESTO (Liu et al. 1993; Golay et al. 2000), increase volume coverage efficiency in fMRI by taking advantage of TE delays to apply additional RF pulses, but run into restrictions at higher magnetic fields when T2 and T2* become inherently short.
Motivated by the prospect of acquiring high resolution, single shot whole brain images at 7 Tesla, but confronted with the afore-listed limitations in whole brain coverage as a major impediment, we recently introduced multiband (MB) EPI imaging for fMRI based on acceleration in two dimensions, slice acceleration and in-plane phase-encode acceleration simultaneously, in order to achieve significant reductions in whole brain coverage time without substantial or even noticeable degradation in image quality or SNR (Moeller et al. 2008; Moeller et al. 2010). In this technique, several slices are simultaneously excited using multiband RF pulses and subsequently acquired in a single EPI echo train using additional acceleration along the phase encode direction; the simultaneously acquired slices are then unaliased using parallel imaging principles. The acceleration using multiple slice excitation dates back to 2001. Simultaneous acquisition of multiple slices using GRE and subsequently unfolding them using parallel imaging principles was described for spine imaging (Larkman et al. 2001) it 2001. This GRE approach was further pursued in the CAIPIRINHA (Controlled Aliasing In Parallel Imaging Results In Higher Acceleration) (Breuer et al. 2005; Breuer et al. 2006) technique where unaliasing of slices were improved by manipulating the phase of the RF excitation pulses progressively for each k-space line in the GRE sequence, so as to effectively shift the simultaneously acquired slices relative to each other in the phase encoding direction. The fMRI community, including us, had probably ignored these earlier efforts because they were based on gradient recalled echoes with application of one RF pulse per k-space line coverage, an approach that is simply inadequate for fMRI. A method employing gradients blips to achieve a shift for controlled aliasing as in CAIPIRINHA in multiband EPI imaging was also described in an abstract (Nunes et al. 2006). However, the approach led to voxel tilting that was in general not desirable. In our EPI implementation such controlled aliasing was not employed. Yet, we were able to attain 4 fold slice acceleration simultaneously with 4 fold acceleration in the phase encode direction, resulting in 16 fold two dimensional acceleration with 16 fold maximum aliasing.
The multiband/multislice approach has been applied rarely, either in its original form or in the CAIPIRINHA versions; subsequent to our work reviving the approach and demonstrating its potential utility (Moeller et al. 2008; Moeller et al. 2010), its use has been rapidly increasing: It has been incorporated into the Steady State Free Precession (SSFP) sequence (Stab et al. 2011) and radial acquisitions (Yutzy et al. 2011). CAIPIRINHA (Breuer et al. 2005; Breuer et al. 2006) like shifting of slices in Multiband EPI acquisition to improve g-factor penalties in unaliasing, using an gradient blip strategy similar to the strategy described previously (Nunes et al. 2006), but avoiding the voxel tilt, was introduced (Setsompop et al. 2011). We have described a modification of the Multiband EPI method that combines it with the simultaneous image refocused (SIR) scheme (Feinberg et al. 2002) which temporally interleaves signals from several slices within an EPI echo train; in this new approach, referred to as Multiplexed-EPI (M-EPI), if multiband pulses with m bands are used for each of the s interleaved RF pulses in the SIR technique (where m and s are positive non-zero integers), the result is simultaneous acquisition of m times s (i.e. m ∙ s) slices in a single echo train. The Multiplexed-EPI sequence and some images obtained with the different acceleration factors are shown in Figure 9. We have further optimized acquisition strategies to improve the ability to unalias multiple slices, achieving 6 to 8 fold slice acceleration at 3 Tesla with a 32 channel RF coil (Xu et al. 2012).
Although these slice-accelerated sequences have been introduced for fMRI initially at 7 Tesla (Moeller et al. 2008; Moeller et al. 2010), so far their use to study human brain function has only been reported at 3T (Smith et al. 2012); in this work, taking advantage of the most recent improvements achieved in our lab (Xu et al. 2012), and exploiting the improved temporal resolution and the large number of data points that can be acquired in a given period of time, time series data obtained with Multiband EPI was employed to identify functionally distinct networks, referred to as temporal functional modes (TFM), by virtue of their temporal independence; these functionally-distinct modes of spontaneous brain activity were, in general, quite different from resting-state networks (RSN) previously reported, and may have greater biological interpretability. Some of these TFMs were shown to subdivide the default-mode network identified as a RSN.
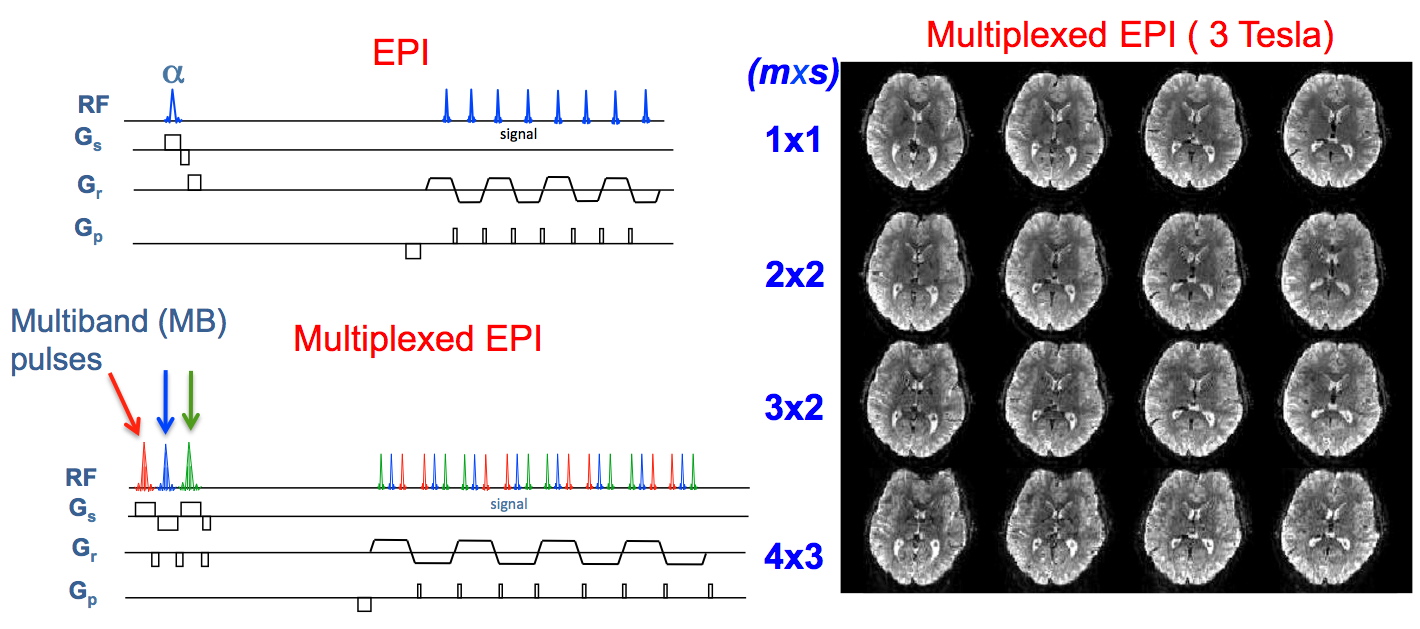
FIGURE 9: The pulse sequence for regular EPI and Multiplexed EPI (M-EPI) and images obtained with Multiplexed EPI images. EPI pulse sequence generates a single slice image during each readout train, which is repeated by the number of slices to scan the whole brain; replacing the single slice pulse with multiband (MB) pulse in this sequence to excite several slices simultaneously, and then unaliasing them using array coil sensitivity profiles yields the Multiband technique (79] which requires fewer repeats to scan the whole brain. Multiplexed-EPI (M-EPI) pulse sequence combines the SIR approach with MB technique: SIR consecutively excites s slices (s = 3) is shown in the pulse sequence diagram with pulses in red, blue and green) and acquires them in a single echo train. Using MB pulses that simultaneously excite m slices for each of the single slice pulses in the SIR approach produces the M-EPI sequence, with a slice acceleration of (s ∙ m) leading to (s ∙ m) number of slices collected in a single echo train. Four slices from 2 mm isotropic resolution, 60 slice, whole brain 3 Tesla data set obtained with the M-EPI technique are shown, together with the (s ∙ m) acceleration factors employed. Adapted from Feinberg et al. 2010; Moeller et al. 2010.
DECODING AND ENCODING WITH BOLD fMRI
Two relatively recent developments with fMRI are worth mentioning briefly with some references given for the reader to pursue further should they decide to do so. These developments involve the use of multivariate machine learning algorithms to decode brain activity patterns and a strategy that can be termed as encoding (Naselaris et al. 2011). Both of these methods offer new possibilities, especially when coupled with the information rich, high resolution, and high specificity functional mapping available at ultrahigh magnetic fields.
Multivariate machine learning algorithms applied to GE fMRI data obtained at 3 Tesla were shown to decode visual stimuli (Haxby et al. 2001; Haynes and Rees 2005; Kamitani and Tong 2005). These algorithms were able to reveal the presence of information that is known to be functionally segregated in cortical columns, e.g. ocular dominance, orientation and direction of motion. This was considered a particularly surprising result since the data were obtained with a large voxel size, 3×3×3 mm3, while these columns have dimensions of ~1 mm; in addition, the data were acquired at 3 T with GE fMRI where functional specificity is not expected to be sufficient to image at the columnar level. The functional images generated in this process have no resemblance to the actual columnar architecture. Nevertheless, voxels were found that demonstrated a preferential activation corresponding to a unique column, such as an orientation specific column.
The mechanism by which such low-resolution imaging decodes information represented at a much finer scale relative to the voxel size has been a source of debate and experimentation. Biased sampling of cortical columns by the large voxels has been hypothesized (Kamitani and Tong 2005; Haynes and Rees 2006; Kamitani and Tong 2006; Bianciardi et al. 2011). Biased sampling occurs due to the specific position that a large voxel takes within a fine columnar organization with local variations, even if the overall preferences represented by the columns are distributed equally across the investigated cortical region. Alternatively, draining macroscopic blood vessels can have bias with respect to cortical columns and thus could display selective responses (Kamitani and Tong 2005; Kamitani and Tong 2006; Chaimow et al. 2010; Shmuel et al. 2010; Bianciardi et al. 2011). The presence of bias in draining vessels with respect to ocular dominance columns was directly demonstrated in high-resolution columnar level mapping at 7 Tesla (Yacoub et al. 2007). Further analysis of these data with decoding algorithms revealed that discriminative power was conveyed by both macroscopic blood vessels and coarse-scale organization of the columnar organization, in other words irregularities in the distribution of different columns, in the gray matter areas (Shmuel et al. 2010). A detailed modeling study was performed to examine the latter, considering the pattern of cortical columns, the hemodynamic point spread function at 3 Tesla, the voxel size employed in the 3 Tesla decoding studies, and noise (Chaimow et al. 2010). These model studies demonstrated that sub-voxel supra-Nyquist spatial frequencies, including frequencies near the main frequency of the ocular dominance organization (spatial frequency of 0.5 cycles per mm) cannot contribute to the differential contrast in GRE fMRI and that the differential functional contrast of local origin is dominated by low-amplitude contributions from low frequencies, associated with irregularities of the cortical pattern (Chaimow et al. 2010). However, decoding due to such irregularities predicted decoding performances much lower than those that have been experimentally observed at 3 Tesla, suggesting the presence of additional mechanisms, such as the presence of biased draining veins implicated in Shmuel et al. (2010).
The decoding approaches described above rely predominantly on classification of image voxels where a pattern of activity across multiple voxels is used to construct a discrete class of stimulus response. Recent studies have moved beyond classification and demonstrated stimulus reconstruction to produce a literal picture of the image that was presented. Reconstruction of geometric stimuli composed of flickering checkerboard patterns was achieved by analyzing the responses of voxels in early visual areas using GRE fMRI (Thirion et al. 2006; Miyawaki et al. 2008). The more complex task of reconstruction of natural images was undertaken with significant success using forward encoding models of each voxel (Kay et al. 2008; Naselaris et al. 2009; Naselaris et al. 2011). These results suggest that it may soon be possible to reconstruct a picture of a person's visual experience from measurements of functional imaging. In this quest, ultrahigh field fMRI is bound to play a critical role since it will provide many more informative and independent voxels with finer, more specific, information content so as to enable the expansion of encoding models and provide substantial increases in discriminative power.
CONCLUSIONS
Our understanding of MR detectable functional signals in the brain has improved significantly over the years since the development of the methodology. At the same time, we have seen major advances and refinements in instrumentation, such as the introduction of ultrahigh field instruments of ever increasing sophistication and refinement, and data acquisition and image analysis methodologies that have significantly impacted data quality. These fantastic improvements today enable mapping of cortical columns, layer specific activation or brain reading. These advances are sure to continue unabated for years to come as new instruments like the 10.5 Tesla system expected at the University of Minnesota and the 11.7 Tesla systems planned for the Intramural Research division of NIH and NeuroSpin Laboratory in France will come on line. With these instruments and the ever improving data analysis methods, MR based functional imaging may be performed in the not so distant future with totally different approaches and provide substantially better information than the already available rich techniques at the cutting edge today.
If one considers an infinite cylinder as an approximation for a blood vessel with magnetic susceptibility difference ∆χ, then the magnetic field at any point in space, will be perturbed from the applied magnetic field (Springer and Xu 1991). Inside the cylinder, the perturbation, Δν, in Hz will be given by the equation:
![]() (1)
(1)
At any point outside the cylinder, designated by the vector ![]() , the magnetic field will vary depending on the distance and orientation relative to the blood vessel and the external magnetic field direction, according to the equation:
, the magnetic field will vary depending on the distance and orientation relative to the blood vessel and the external magnetic field direction, according to the equation:
![]() (2)
(2)
In these equations, the parameter γB0 is the Larmour frequency of water protons expressed as an angular frequency in rad/s, B0 is the magnetic field and γ is the gyromagnetic ratio, which is 2.6751965 x 10⁸ rad s-1 Tesla-1 or equivalently 42.577 in units of MHz/Tesla in a spherical water sample. The angles are defined in Figure 10; θ is the angle the cylinder makes the magnetic field B0, generated by the magnet; for any given point in space, φ is the angle of the vector from that point running perpendicularly to the cylinder and the plane defined by the cylinder and the magnetic field B0. Δχ0 is the maximum susceptibility difference, expressed as parts per million (ppm) expected in the presence of fully deoxygenated blood (and depends on the hematocrit); Y0 is the fraction of oxygenated blood at which the susceptibility difference between the blood and the surrounding tissue is zero, and Y is the fraction of oxygenated blood present in the vessel under consideration. Y0 is usually assumed to be 1, as in (Ogawa et al. 1993); recent data assigns it a value of ~0.95 (Spees et al. 2001). Also varying values exist for Δχ0; 0.264 ppm at unit hematocrit was recently determined experimentally (Spees et al. 2001) and differs from the value of 0.18 and 0.31 ppm used in some of the other earlier studies. At a hematocrit value of 0.4, Δχ0 is, therefore, (0.264•0.4), which is 0.106; a value of 0.1 was used in (Ogawa et al. 1993). The parameter rb designates the cylinder radius, r is the distance from the point of interest to the center of the cylinder in the plane normal to the cylinder. Note that outside the cylinder, the magnetic field changes rapidly over a distance comparable to two or three times the cylinder radius; at a distance equal to the diameter of the cylinder from the cylinder center, Δνout is already down to 25% of its value at the cylinder boundary.
Since there are often different units and nomenclatures used, we can present a sample calculation: Using Δχ0 of 0.264 ppm at unit hematocrit, a blood hematocrit of 0.4, Y0 of 0.95, the parameter ![]() is calculated for 1 Tesla and at Y of 0.6, typical of brain venous blood, as (0.264x10⁻⁶•0.4)•(0.95-0.6)(2.6751965x10⁸) = 9.89 Hz; thus,
is calculated for 1 Tesla and at Y of 0.6, typical of brain venous blood, as (0.264x10⁻⁶•0.4)•(0.95-0.6)(2.6751965x10⁸) = 9.89 Hz; thus, ![]() ~10 Hz for 1 Tesla, an easy round number to remember. Note that this applies for the veins. Capillaries, which also contain deoxyhemoglobin, do not have Y =0.6. In these vessels Y changes from arteriolar level (~1) to the venous level (~0.6) along the length of the blood vessel. Thus, using the average along the length of the capillary, is ~5 Hz for 1 Tesla, half of the value for veins.
~10 Hz for 1 Tesla, an easy round number to remember. Note that this applies for the veins. Capillaries, which also contain deoxyhemoglobin, do not have Y =0.6. In these vessels Y changes from arteriolar level (~1) to the venous level (~0.6) along the length of the blood vessel. Thus, using the average along the length of the capillary, is ~5 Hz for 1 Tesla, half of the value for veins.
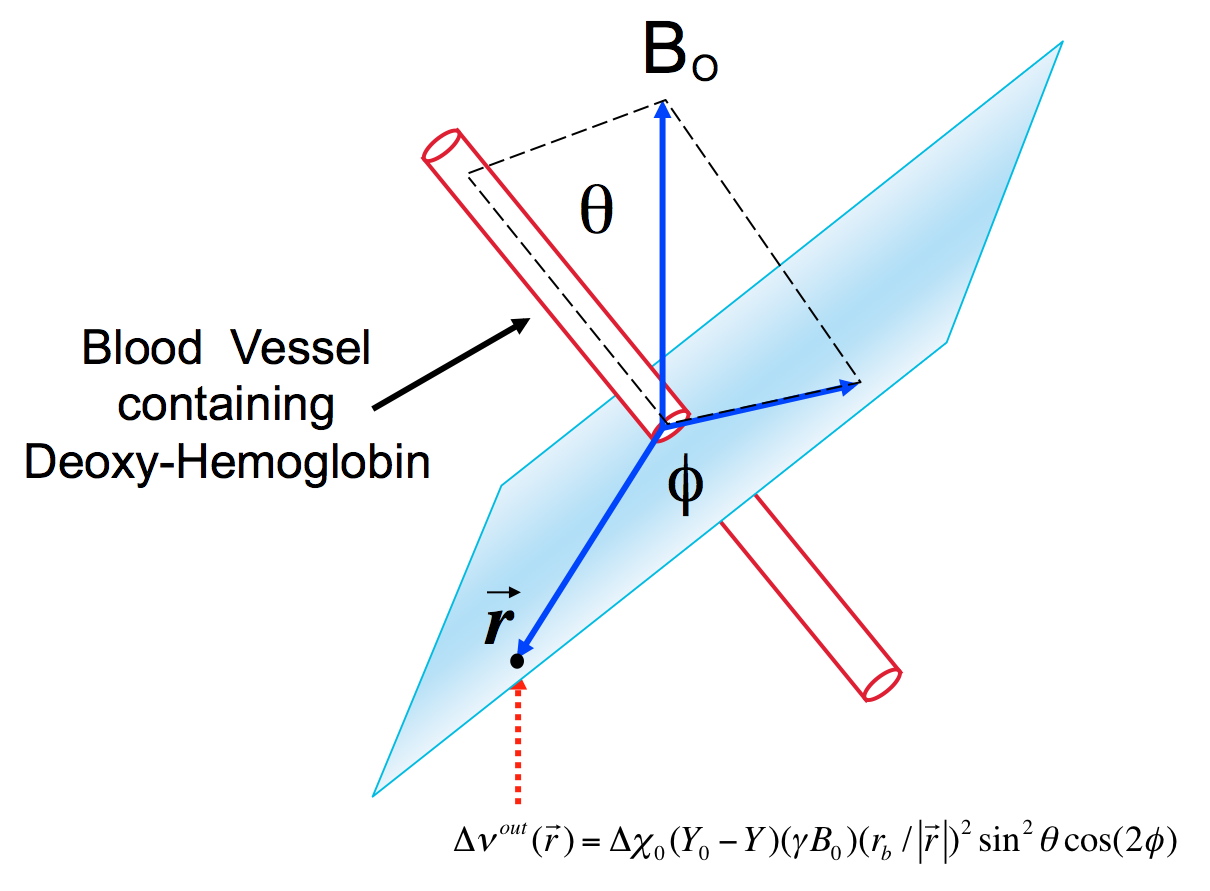
FIGURE 10: The angles and distances that come into play in the equation describing the magnetic field outside a cylinder oriented relative to the main external magnetic field B0 at an angle θ.
APPENDIX 2: Brief introduction into Data Acquisition in fMRI
In BOLD contrast, a signal is acquired simply after a delay, TE, following excitation. A refocusing pulse may or may not be applied during this delay. When refocusing pulses are not applied, one uses field gradient reversal to form an echo in imaging; consequently, such echoes are called gradient-recalled or gradient echoes, abbreviated simply as GRE. This is the first MR sequence used for functional mapping with the BOLD approach (Bandettini et al. 1992; Kwong et al. 1992; Ogawa et al. 1992). In the presence of a refocusing pulse, the spin-echo (SE) signal (i.e. echo-amplitude) detected after the echo time TE decreases according to exp(-TE/T2) where T2 is the spin-lattice relaxation time associated with the loss of magnetization with time in the transverse plane, the plane perpendicular to the main static magnetic field B0. Spin echoes can also yield functional information in the brain leading to SE based fMRI. SE fMRI is sensitive only to a subset of the processes that lead to BOLD contrast in the GRE experiment, while everything that provides functional signals in SE fMRI also contribute to GRE fMRI.
In a gradient echo, signal loss occurs through T2 relaxation as well as by signal cancellation that arises due to dephasing of the magnetization in the presence of magnetic field inhomogeneities. The latter is recoverable with a refocusing pulse and does not contribute to spin-echoes. In a gradient echo image, the appropriate relaxation constant of magnetization in the transverse plane is T2*. T2 of pure water is dominated by the magnetic interactions between the two hydrogen atoms, through the dipole-dipole coupling. In the human brain, this is still the case but the water is not in a pure form; rather, it exists in many different environments, such as tightly or weakly bound to macromolecules and metal ions, or free of such binding. The presence of these different states and the exchange between them affect the T2 of the water resonance. The hydrogen atom of the water molecule itself can exchange between water and exchangeable –NH or –OH hydrogens on macromolecules. All of these processes affect the water proton T2 and impart the contrast that allows the differentiation of one type of tissue from another in MRI. Another mechanism that contributes to T2 is diffusion of water molecules around magnetic field inhomogeneities; normally in the brain this is not a very large affect though it is present and detectable especially at high magnetic fields (Bartha et al. 2002; Michaeli et al. 2002).
T2*, on the other hand, has contributions from all of the process that affect T2 plus the dephasing effect in the presence of magnetic field inhomogeneities. In a container of pure water placed in a fully homogenous external magnetic field, T2 equals T2*, except near the boundaries of the container where the magnetic field can be non-uniform. This is not the case in the brain because of magnetic field inhomogeneities that span scales ranging from microns to many millimeters and even centimeters as encountered around the air filled cavities adjacent to the brain. On the micron to millimeter scale, the inhomogeneities exist around metal containing enzymes, intracellular structures, myelin, and deoxyhemoglobin containing blood vessels ranging from capillaries to large veins; it is this last effect that provides functional mapping signals. Oxygenated blood is diamagnetic and has similar properties to tissue. However, the deoxyhemoglobin molecule is paramagnetic, and its presence leads to a large susceptibility difference between compartments that contain this molecule and others that are devoid of it. Thus, against a backdrop of numerous contributions to the inherent T2 and T2* of brain water, BOLD contrast refers to a T2* or T2 mechanism arising from magnetic field inhomogeneities generated by magnetic susceptibility differences across the luminal boundaries of blood vessels. During increased neuronal activity, deoxyhemoglobin content is altered in the brain; this change is accompanied by small but measurable decreases in T2 and T2*, which was experimentally documented in the early days of fMRI (Menon et al. 1993).
Image acquisition can be accomplished using slices where a frequency selective RF pulse is employed to restrict the signal origin to a single slice, typically ~1 to 3 mm in thickness at the present time, though as large as 10 mm slices were not uncommon in the early days of fMRI.
In MR imaging terminology, k-space refers to the two or three-dimensional matrix of data points collected during image acquisition. When the image acquired is from a slice only, the k-space data reside in two dimensions, representing the encoding along two orthogonal directions that define a plane perpendicular to the slice selection direction. A 2-dimensional Fourier transform then converts this into an image of the slice. In techniques like FLASH (Haase et al. 1986) and see reviews Haacke and Tkach 1990; Chien and Edelman 1991; Haacke et al. 1991), one line along a single dimension of k-space is collected after each RF pulse and multiple RF pulses are employed to cover the entire k-space in seconds. In approaches like single-shot Echo Planar imaging (EPI) (Mansfield 1977) or SPIRAL imaging (e.g. Yang et al. 1998), the entire k-space is covered after a single RF pulse using a train of gradient echoes in ~20 to 100 ms depending on the available hardware and the field magnitude at which the data are collected. Segmented EPI schemes (McKinnon 1993; Feinberg and Oshio 1994; Wielopolski et al. 1995) cover more than 1 line but less than the entire k-space in a single echo train after one RF pulse. They have been particularly useful in high-resolution functional imaging studies (Yacoub et al. 2007; Yacoub et al. 2008) because the higher resolution dictates the acquisition of many more k-space lines and points along each line.
Single shot techniques provide distinct advantages to the others for fMRI. These include the ability to cover the whole brain rapidly, and to partially suppress temporal signal fluctuations in an fMRI time series. The latter touches on a very interesting subject: Namely, in consecutively acquired images from the brain, temporal signal variations contain contributions from and can even be dominated by physiologically induced processes such as blood vessel pulsation (vasomotion), respiration, and spontaneous neuronal activity (see discussion further on). Of course, the intrinsic signal-to-noise ratio (SNR) of a single image has to be sufficiently good to detect these physiologically induced variations. These temporal instabilities come into single shot versus multiple shot acquisitions in a different way and are much more deleterious for the latter (Hu and Kim 1994; Hu et al. 1995). They can be minimized by post-processing strategies in multiple shot as well as in single shot techniques (e.g. Hu and Kim 1994; Hu et al. 1995; Mitra et al. 1995; Biswal et al. 1996; Ogawa et al. 1996; Mitra et al. 1997; Mitra and Pesaran 1999; Glover et al. 2000; Pfeuffer et al. 2002; Van De Moortele et al. 2002). However, such strategies require intrinsically good SNR and, and in some cases, rapid image acquisition so as to capture these temporal fluctuations accurately.
At higher magnetic fields, it is necessary to acquire single shot images faster because the MR signal disappears faster subsequent to excitation (i.e. the T2* is shorter) due to increased magnetic field inhomogeneities. A critical development in this respect has been parallel imaging (PI) techniques which utilize the spatial information inherent in multiple surface coils distributed over the sample so as to omit some of the k-space lines as if the image was being acquired with a reduced field of view (FOV). Consequently, the time spent acquiring the signal after the RF pulse is shorter, which for EPI translates into shorter echo trains. When processed without the use of the spatial information from array coil sensitivity profiles, images acquired in this fashion display sections that are folded on top of each other, in other words sections that are aliased. However, they can be unfolded using parallel imaging techniques. The utility of parallel imaging has been examined for functional imaging early on after their introduction (de Zwart et al. 2006; Moeller et al. 2006); today, they are typically part of the normal fMRI acquisition, especially at high magnetic fields.
Parallel imaging works better at high magnetic fields (Ohliger et al. 2003; Wiesinger et al. 2004; Wiesinger et al. 2006) and high magnetic fields need the use of parallel imaging relatively more because of the short window available for data acquisition due to the short T2* (e.g. see (Yacoub et al. 2001; Yacoub et al. 2003; Uludag et al. 2009) and references therein). Thus, parallel imaging and high fields are synergistic. Partial Fourier (Feinberg et al. 1986) sampling, or sparse data sampling approaches (Liang et al. 2003) are also approaches that reduce the image encoding times. With the use of these techniques, it is feasible today to acquire single shot high-resolution EPI images at high fields such as 7 Tesla, as illustrated in Figure 6.
Parallel Imaging, and Partial Fourier sampling reduce the number of phase encoding steps for spatial encoding, and consequently, the echo train length after a single RF pulse; however, they do not necessarily reduce whole brain image acquisition times significantly in many applications. Significantly faster acquisitions can be obtained using the Multiband technique as discussed in the main body of the article.
- The frequency range 300 MHz to 3 GHz is defined as Ultra High Frequency (UHF). The hydrogen nucleus resonance frequency at 7 Tesla is ~300 MHz i.e. in UHF band. Therefore, 7 to 70 Tesla is defined as Ultra High Field (UHF).
(see http://en.wikipedia.org/wiki/Ultra_high_frequency) - In reality, this statement is correct strictly if we treat blood as a homogeneous medium with a magnetic susceptibility that differs from the surrounding tissue. However, in blood, deoxyhemoglobin is compartmentalized within red blood cells. This leads to magnetic field inhomogeneities around the red blood cells, thus to a non-uniform field distribution within the blood. However, the spatial scale of these inhomogeneities is sufficiently small that water diffusion averages them out; thus, blood water experiences effectively a uniform field.
- The resonance frequency, also known as the Larmor frequency, of a magnetic nucleus such as that of hydrogen atom, is given by γB0 where γ is the gyromagnetic ratio which is a fundamental constant associated with the nucleus and B0 is the magnetic field experienced by the nucleus.
The work reported in this review that was carried out at the Center for Magnetic Resonance Research (CMRR), University of Minnesota, was supported by a Biomedical Technology Research Center grant (Grant Number P41 RR008079 from NCRR/P41 EB015894 from NIBIB) and Neuroscience Center Core grant P30 NS057091 from NINDS of the National Institutes of Health, and the Keck Foundation.
Adriany G, Van de Moortele PF, Wiesinger F, Moeller S, Strupp JP, Andersen P, Snyder C, Zhang X, Chen W, Pruessmann KP, Boesiger P, Vaughan T, Ugurbil K (2005) Transmit and receive transmission line arrays for 7 Tesla parallel imaging. Magn Reson Med 53(2):434-445.
Albright TD (1984) Direction and orientation selectivity of neurons in visual area MT of the macaque. J Neurophysiol 52(6):1106-1130.
Albright TD, Desimone R, Gross CG (1984) Columnar organization of directionally selective cells in visual area MT of the macaque. J Neurophysiol 51(1):16-31.
Bandettini PA, Wong EC (1995) Effects od biophysical and physiologic parameters on brain activation induced R2* and R2 changes: Simulations using a deterministic diffusion model. International Journal of Imaging Systems & Technology. 6(2-3):133-152, 1995 Sum-Fal. 6(2-3)(133-152).
Bandettini PA, Wong EC, Hinks RS, Tikofsky RS, Hyde JS (1992) Time course EPI of human brain function during task activation. Magn Reson Med 25(2):390-397.
Barbier EL, Silva AC, Kim HJ, Williams DS, Koretsky AP (1999) Perfusion analysis using dynamic arterial spin labeling (DASL). Magn Reson Med 41(2):299-308.
Barbier EL, Silva AC, Kim SG, Koretsky AP (2001) Perfusion imaging using dynamic arterial spin labeling (DASL). Magn Reson Med 45(6):1021-1029.
Barth M, Moser E (1997) Proton NMR relaxation times of human blood samples at 1.5 T and implications for functional MRI. Cell Mol Biol (Noisy-le-grand) 43(5):783-791.
Bartha R, Michaeli S, Merkle H, Adriany G, Andersen P, Chen W, Ugurbil K, Garwood M (2002) In vivo 1H2O T2+ measurement in the human occipital lobe at 4T and 7T by Carr-Purcell MRI: detection of microscopic susceptibility contrast. Magn Reson Med 47(4):742-750.
Belle V, Delon-Martin C, Massarell iR, Decety J, Le Bas J, Benabid A, Segebarth C (1995) Intracranial gradient-echo and spin-echo functional MR angiography in humans. Radiology 195(3):739-746.
Belliveau JW, Kennedy DN, McKinstry RC, Buchbinder BR, Weisskoff RM, Cohen MS, Vevea JM, Brady TJ, Rosen BR (1991) Functional Mapping of the Human Visual Cortex by Magnetic Resonance Imaging. Science 254:716-719.
Bianciardi M, Fukunaga M, van Gelderen P, de Zwart JA, Duyn JH (2011) Negative BOLD-fMRI signals in large cerebral veins. Journal of cerebral blood flow and metabolism : official journal of the International Society of Cerebral Blood Flow and Metabolism 31(2):401-412.
Bianciardi M, Fukunaga M, van Gelderen P, Horovitz SG, de Zwart JA, Duyn JH (2009a) Modulation of spontaneous fMRI activity in human visual cortex by behavioral state. Neuroimage 45(1):160-168.
Bianciardi M, Fukunaga M, van Gelderen P, Horovitz SG, de Zwart JA, Shmueli K, Duyn JH (2009b) Sources of functional magnetic resonance imaging signal fluctuations in the human brain at rest: a 7 T study. Magn Reson Imaging 27(8):1019-1029.
Bianciardi M, van Gelderen P, Duyn JH, Fukunaga M, de Zwart JA (2009c) Making the most of fMRI at 7 T by suppressing spontaneous signal fluctuations. Neuroimage 44(2):448-454.
Biswal B, DeYoe AE, Hyde JS (1996) Reduction of physiological fluctuations in fMRI using digital filters. Magn Reson Med 35(1):107-113.
Boxerman JL, Bandettini PA, Kwong KK, Baker JR, Davis TL, Rosen BR, Weisskoff RM (1995a) The intravascular contribution to fMRI signal change: Monte Carlo modeling and diffusion-weighted studies in vivo. Magn Reson Med 34(1):4-10.
Boxerman JL, Hamberg LM, Rosen BR, Weisskoff RM (1995b) MR contrast due to intravscular magnetic susceptiblity perturbations. Magn Reson Med 34:555-556.
Breuer FA, Blaimer M, Heidemann RM, Mueller MF, Griswold MA, Jakob PM (2005) Controlled aliasing in parallel imaging results in higher acceleration (CAIPIRINHA) for multi-slice imaging. Magnetic resonance in medicine : official journal of the Society of Magnetic Resonance in Medicine / Society of Magnetic Resonance in Medicine 53(3):684-691.
Breuer FA, Blaimer M, Mueller MF, Seiberlich N, Heidemann RM, Griswold MA, Jakob PM (2006) Controlled aliasing in volumetric parallel imaging (2D CAIPIRINHA). Magnetic resonance in medicine : official journal of the Society of Magnetic Resonance in Medicine / Society of Magnetic Resonance in Medicine 55(3):549-556.
Budde J, Shajan G, Hoffmann J, Ugurbil K, Pohmann R (2011) Human imaging at 9.4 T using T(2) *-, phase-, and susceptibility-weighted contrast. Magn Reson Med 65(2):544-550.
Chaimow D, Yacoub E, Ugurbil K, Shmuel A (2011) Modeling and analysis of mechanisms underlying fMRI-based decoding of information conveyed in cortical columns. Neuroimage 56(2):627-642.
Cheng K, Waggoner RA, Tanaka K (2001) Human ocular dominance columns as revealed by high-field functional magnetic resonance imaging. Neuron 32(2):359-374.
Chien D, Edelman RR (1991) Ultrafast imaging using gradient echoes. Magn Reson Quarterly 5(1):31-56.
Crowe DA, Chafee MV, Averbeck BB, Georgopoulos AP (2004) Neural activity in primate parietal area 7a related to spatial analysis of visual mazes. Cerebral cortex 14(1):23-34.
De Martino F, Esposito F, van de Moortele PF, Harel N, Formisano E, Goebel R, Ugurbil K, Yacoub E (2011) Whole brain high-resolution functional imaging at ultra high magnetic fields:An application to the analysis of resting state networks. Neuroimage 57(3):1031-1044.
de Zwart JA, van Gelderen P, Golay X, Ikonomidou VN, Duyn JH (2006) Accelerated parallel imaging for functional imaging of the human brain. NMR Biomed 19(3):342-351.
Detre JA, Leigh JS, Williams DS, Koretsky AP (1992) Perfusion imaging. Magn Reson Med 23(1):37-45.
Detre JA, Zhang W, Roberts DA, Silva AC, Williams DS, Grandis DJ, Koretsky AP, Leigh JS (1994) Tissue specific perfusion imaging using arterial spin labeling. NMR Biomed 7(1-2):75-82.
DeYoe EA, Carman GJ, Bandettini P, Glickman S, Wieser J, Cox R, Miller D, Neitz J (1996) Mapping striate and extrastriate visual areas in human cerebral cortex. Proc Natl Acad Sci U S A 93(6):2382-2386.
Duong TQ, Kim DS, Ugurbil K, Kim SG (2000a) Spatiotemporal dynamics of the BOLD fMRI signals: toward mapping submillimeter cortical columns using the early negative response. Magn Reson Med 44(2):231-242.
Duong TQ, Kim DS, Ugurbil K, Kim SG (2001) Localized cerebral blood flow response at submillimeter columnar resolution. Proc Natl Acad Sci U S A 98(19):10904-10909.
Duong TQ, Silva AC, Lee SP, Kim SG (2000b) Functional MRI of calcium-dependent synaptic activity: cross correlation with CBF and BOLD measurements Magn Reson Med 43(3):383-392.
Duong TQ, Yacoub E, Adriany G, Hu X, Ugurbil K, Kim SG (2003) Microvascular BOLD contribution at 4 and 7 T in the human brain: Gradient-echo and spin-echo fMRI with suppression of blood effects. Magn Reson Med 49(6):1019-1027.
Duyn JH, Moonen CT, van Yperen GH, de Boer RW, Luyten PR (1994) Inflow versus deoxyhemoglobin effects in BOLD functional MRI using gradient echoes at 1.5 T. NMR in biomedicine 7(1-2):83-88.
Duyn JH, van Gelderen P, Li TQ, de Zwart JA, Koretsky AP, Fukunaga M (2007) High-field MRI of brain cortical substructure based on signal phase. Proc Natl Acad Sci U S A 104(28):11796-11801.
Edelman RE, Siewer B, Darby DG, Thangaraj V, Nobre AC, Mesulam MM, Warach S (1994) Quantitative mapping of cerebral blood flow and functional localization with echo-planar MR imaging and signal targeting with alternating radio frequency. Radiology 192:513-520.
Engel SA, Glover GH, Wandell BA (1997) Retinotopic organization in human visual cortex and the spatial precision of functional MRI. Cereb Cortex 7(2):181-192.
Feinberg DA, Hale JD, Watts JC, Kaufman L, Mark A (1986) Halving MR imaging time by conjugation:demonstration at 3.5 kG. Radiology 161(2):527-531.
Feinberg DA, Moeller S, Smith SM, Auerbach E, Ramanna S, Glasser MF, Miller KL, Ugurbil K, Yacoub E (2010) Multiplexed echo planar imaging for sub-second whole brain FMRI and fast diffusion imaging. PLoS ONE 5(12):e15710.
Feinberg DA, Oshio K (1994) Phase errors in multi-shot echo planar imaging. Magnetic resonance in medicine: official journal of the Society of Magnetic Resonance in Medicine / Society of Magnetic Resonance in Medicine 32(4):535-539.
Feinberg DA, Reese TG, Wedeen VJ (2002) Simultaneous echo refocusing in EPI. Magn Reson Med 48(1):1-5.
Formisano E, Kim DS, Di Salle F, van de Moortele PF, Ugurbil K, Goebel R (2003) Mirror-symmetric tonotopic maps in human primary auditory cortex. Neuron 40(4):859-869.
Fox PT, Raichle ME (1986) Focal physiological uncoupling of cerebral blood flow and oxidative metabolism during somatosensory stimulation in human subjects. Proc Natl Acad Sci U S A 83(4):1140-1144.
Fox PT, Raichle ME, Mintun MA, Dence C (1988) Nonoxidative glucose consumption during focal physiologic neural activity. Science 241(4864):462-464.
Frahm J, Merboldt K-D, Hanicke W, Kleinschmidt A, Boecker H (1994) Brain or vein-oxygenation or flow? On signal physiology in functional MRI of human brain activation. NMR in Biomed 7(1/2):45-53.
Fujita I, Tanaka K, Ito M, Cheng K (1992) Columns for visual features of objects in monkey inferotemporal cortex. Nature 360:343-346.
Fujita N (2001) Extravascular contribution of blood oxygenation level-dependent signal changes: a numerical analysis based on a vascular network model. Magn Reson Med 46(4):723-734.
Fukuda M, Moon CH, Wang P, Kim SG (2006) Mapping iso-orientation columns by contrast agent-enhanced functional magnetic resonance imaging: reproducibility, specificity, and evaluation by optical imaging of intrinsic signal. J Neurosci 26(46):11821-11832.
Georgopoulos AP, Ashe J, Smyrnis N, Taira M (1992) The motor cortex and the coding of force. Science 256(5064):1692-1695.
Georgopoulos AP, Grillner S (1989) Visuomotor coordination in reaching and locomotion. Science 245(4923):1209-1210.
Georgopoulos AP, Lurito JT, Petrides M, Schwartz AB, Massey JT (1989) Mental rotation of the neuronal population vector. Science 243(4888):234-236.
Georgopoulos AP, Schwartz AB, Kettner RE (1986) Neuronal population coding of movement direction. Science 233(4771):1416-1419.
Georgopoulos AP, Taira M, Lukashin A (1993) Cognitive neurophysiology of the motor cortex. Science 260(5104):47-52.
Glover GH, Li TQ, Ress D (2000) Image-based method for retrospective correction of physiological motion effects in fMRI: RETROICOR. Magn Reson Med 44(1):162-167.
Goense JB, Zappe AC, Logothetis NK (2007) High-resolution fMRI of macaque V1. Magn Reson Imaging 25(6):740-747.
Golay X, Pruessmann KP, Weiger M, Crelier GR, Folkers PJ, Kollias SS, Boesiger P (2000) PRESTO-SENSE: an ultrafast whole-brain fMRI technique. Magn Reson Med 43(6):779-786.
Goodyear BG, Menon RS (2001) Brief visual stimulation allows mapping of ocular dominance in visual cortex using fMRI. Hum Brain Mapp 14(4):210-217.
Gourtzelidis P, Tzagarakis C, Lewis SM, Crowe DA, Auerbach E, Jerde TA, Ugurbil K, Georgopoulos AP (2005) Mental maze solving: directional fMRI tuning and population coding in the superior parietal lobule. Exp Brain Res 165(3):273-282.
Griswold MA, Jakob PM, Heidemann RM, Nittka M, Jellus V, Wang J, Kiefer B, Haase A (2002) Generalized autocalibrating partially parallel acquisitions (GRAPPA). Magn Reson Med 47(6):1202-1210.
Grubb RL, Jr., Raichle ME, Eichling JO, Ter-Pogossian MM (1974) The effects of changes in PaCO2 on cerebral blood volume, blood flow, and vascular mean transit time. Stroke 5(5):630-639.
Grubb RL, Jr., Raichle ME, Higgins CS, Eichling JO (1978) Measurement of regional cerebral blood volume by emission tomography. Ann Neurol 4(4):322-328.
Haacke EM, Tkach JA (1990) Fast MR imaging: techniques and clinical applications. AJR Am J Roentgenol 155(5):951-964.
Haacke EM, Wieloposki PA, Tkash JA (1991) A comprehensive technical review of short TR, fast, magnetic resonance imaging. Magn Reson Med 3(2):53-170.
Haase A, Frahm J, Matthaei D, Hanicke W, Merboldt KD (1986) FLASH imaging. Rapid NMR imaging using low flip angle pulses. J Magn Reson 67:258-266.
Harel N, Lee SP, Nagaoka T, Kim DS, Kim SG (2002) Origin of negative blood oxygenation level-dependent fMRI signals. J Cereb Blood Flow Metab 22(8):908-917.
Harel N, Lin J, Moeller S, Ugurbil K, Yacoub E (2006a) Combined imaging-histological study of cortical laminar specificity of fMRI signals. Neuroimage 29(3):879-887.
Harel N, Ugurbil K, Uludag K, Yacoub E (2006b) Frontiers of brain mapping using MRI. J Magn Reson Imaging 23(6):945-957.
Harrison RV, Harel N, Panesar J, Mount RJ (2002) Blood capillary distribution correlates with hemodynamic-based functional imaging in cerebral cortex. Cereb Cortex 12(3):225-233.
Haxby JV, Gobbini MI, Furey ML, Ishai A, Schouten JL, Pietrini P (2001) Distributed and overlapping representations of faces and objects in ventral temporal cortex. Science 293(5539):2425-2430.
Haynes JD, Rees G (2005) Predicting the orientation of invisible stimuli from activity in human primary visual cortex. Nat Neurosci 8(5):686-691.
Haynes JD, Rees G (2006) Decoding mental states from brain activity in humans. Nat Rev Neurosci 7(7):523-534.
Henry TR, Chupin M, Lehericy S, Strupp JP, Sikora MA, Sha ZY, Ugurbil K, Van de Moortele PF (2011) Hippocampal sclerosis in temporal lobe epilepsy: findings at 7 T. Radiology 261(1):199-209.
Hoogenraad FG, Hofman MB, Pouwels PJ, Reichenbach JR, Rombouts SA, Haacke EM (1999) Sub-millimeter fMRI at 1.5 Tesla: correlation of high resolution with low resolution measurements. J Magn Reson Imaging 9(3):475-482.
Hoogenraad FG, Pouwels PJ, Hofman MB, Reichenbach JR, Sprenger M, Haacke EM (2001) Quantitative differentiation between BOLD models in fMRI. Magn Reson Med 45(2):233-246.
Howseman AM, Grootoonk SG, Porter D, Ramdeen J, Holmes AP, Turner R (1999) The effect of slice order and thickness on fMRI activation data using multislice EPI. NeuroImage 9(4):363-376.
Hu X, Kim SG (1994) Reduction of signal fluctuation in functional MRI using navigator echoes. Magn Reson Med 31(5):495-503.
Hu X, Le TH, Parrish T, Erhard P (1995) Retrospective estimation and correction of physiological fluctuation in functional MRI. Magn Reson Med 34(2):201-212.
Ito H, Ibaraki M, Kanno I, Fukuda H, Miura S (2005) Changes in the arterial fraction of human cerebral blood volume during hypercapnia and hypocapnia measured by positron emission tomography. Journal of cerebral blood flow and metabolism: official journal of the International Society of Cerebral Blood Flow and Metabolism 25(7):852-857.
Ito H, Takahashi K, Hatazawa J, Kim SG, Kanno I (2001) Changes in human regional cerebral blood flow and cerebral blood volume during visual stimulation measured by positron emission tomography. Journal of cerebral blood flow and metabolism: official journal of the International Society of Cerebral Blood Flow and Metabolism 21(5):608-612.
Jerde TA, Lewis SM, Goerke U, Gourtzelidis P, Tzagarakis C, Lynch J, Moeller S, Van de Moortele PF, Adriany G, Trangle J, Ugurbil K, Georgopoulos AP (2008) Ultra-high field parallel imaging of the superior parietal lobule during mental maze solving. Exp Brain Res 187(4):551-561.
Kamitani Y, Tong F (2005) Decoding the visual and subjective contents of the human brain. Nat Neurosci 8(5):679-685.
Kamitani Y, Tong F (2006) Decoding seen and attended motion directions from activity in the human visual cortex. Curr Biol 16(11):1096-1102.
Kay KN, Naselaris T, Prenger RJ, Gallant JL (2008) Identifying natural images from human brain activity. Nature 452(7185):352-355.
Kayser C, Kim M, Ugurbil K, Kim DS, Konig P (2004) A Comparison of Hemodynamic and Neural Responses in Cat Visual Cortex Using Complex Stimuli. Cereb Cortex 14(8):881-891.
Kennan RP, Scanley BE, Innis RB, Gore JC (1998) Physiological basis for BOLD MR signal changes due to neuronal stimulation: separation of blood volume and magnetic susceptibility effects. Magn Reson Med 40(6):840-846.
Kennan RP, Zhong J, Gore JC (1994) Intravascular susceptibility contrast mechanisms in tissue. Magn Reson Med 31:9-31.
Kim DS, Duong TQ, Kim SG (2000) High-resolution mapping of iso-orientation columns by fMRI. Nat Neurosci 3(2):164-169.
Kim DS, Ronen I, Olman C, Kim SG, Ugurbil K, Toth LJ (2004) Spatial relationship between neuronal activity and BOLD functional MRI. Neuroimage 21(3):876-885.
Kim S-G (1995) Quantification of relative cerebral blood flow change by flow-sensitive alternating inversion recovery (FAIR) technique: application to functional mapping. Magn Reson Med 34:293-301.
Kim S-G, Tsekos NV (1997) Perfusion imaging by a flow-sensitive alternating inversion recovery (FAIR) technique: application to functional brain imaging. Mag Reson Med 37(3):425-435.
Kim SG, Hendrich K, Hu X, Merkle H, Ugurbil K (1994) Potential pitfalls of functional MRI using conventional gradient-recalled echo techniques. NMR Biomed 7(1-2):69-74.
Kim T, Hendrich KS, Masamoto K, Kim SG (2006) Arterial versus total blood volume changes during neural activity-induced cerebral blood flow change: implication for BOLD fMRI. J Cereb Blood Flow Metab.
Kim T, Kim SG (2005) Quantification of cerebral arterial blood volume and cerebral blood flow using MRI with modulation of tissue and vessel (MOTIVE) signals. Magn Reson Med 54(2):333-342.
Kiselev VG, Posse S (1999) Analytical model of susceptibility-induced MR signal dephasing: effect of diffusion in a microvascular network. Magnetic resonance in medicine : official journal of the Society of Magnetic Resonance in Medicine / Society of Magnetic Resonance in Medicine 41(3):499-509.
Kjolby BF, Ostergaard L, Kiselev VG (2006) Theoretical model of intravascular paramagnetic tracers effect on tissue relaxation. Magnetic resonance in medicine :official journal of the Society of Magnetic Resonance in Medicine / Society of Magnetic Resonance in Medicine 56(1):187-197.
Kuo PH, Kanal E, Abu-Alfa AK, Cowper SE (2007) Gadolinium-based MR contrast agents and nephrogenic systemic fibrosis. Radiology 242(3):647-649.
Kwong KK, Belliveau JW, Chesler DA, Goldberg IE, Weisskoff RM, Poncelet BP, Kennedy DN, Hoppel BE, Cohen MS, Turner R, et al. (1992) Dynamic magnetic resonance imaging of human brain activity during primary sensory stimulation. Proc Natl Acad Sci U S A 89(12):5675-5679.
Larkman DJ, Hajnal JV, Herlihy AH, Coutts GA, Young IR, Ehnholm G (2001) Use of multicoil arrays for separation of signal from multiple slices simultaneously excited. J Magn Reson Imaging 13(2):313-317.
Lee SP, Duong TQ, Yang G, Iadecola C, Kim SG (2001) Relative changes of cerebral arterial and venous blood volumes during increased cerebral blood flow: implications for BOLD fMRI. Magn Reson Med 45(5):791-800.
Lee SP, Silva AC, Kim SG (2002) Comparison of diffusion-weighted high-resolution CBF and spin-echo BOLD fMRI at 9.4 T. Magn Reson Med 47(4):736-741.
Lee SP, Silva AC, Ugurbil K, Kim SG (1999) Diffusion-weighted spin-echo fMRI at 9.4 T: microvascular/tissue contribution to BOLD signal changes. Magn Reson Med 42(5):919-928.
Leite FP, Tsao D, Vanduffel W, Fize D, Sasaki Y, Wald LL, Dale AM, Kwong KK, Orban GA, Rosen BR, Tootell RB, Mandeville JB (2002) Repeated fMRI using iron oxide contrast agent in awake, behaving macaques at 3 Tesla. Neuroimage 16(2):283-294.
Liang ZP, Madore B, Glover GH, Pelc NJ (2003) Fast algorithms for GS-model-based image reconstruction in data-sharing Fourier imaging. IEEE Trans Med Imaging 22(8):1026-1030.
Lin YJ, Koretsky AP (1997) Manganese ion enhances T1-weighted MRI during brain activation: an approach to direct imaging of brain function. Magn Reson Med 38(3):378-388.
Liu G, Sobering G, Duyn J, Moonen CT (1993) A functional MRI technique combining principles of echo-shifting with a train of observations (PRESTO). Magn Reson Med 30(6):764-768.
Lu H, Golay X, Pekar JJ, Van Zijl PC (2003) Functional magnetic resonance imaging based on changes in vascular space occupancy. Magn Reson Med 50(2):263-274.
Lu H, Law M, Johnson G, Ge Y, van Zijl PC, Helpern JA (2005) Novel approach to the measurement of absolute cerebral blood volume using vascular-space-occupancy magnetic resonance imaging. Magn Reson Med 54(6):1403-1411.
Malonek D, Grinvald A (1996) Interactions between electrical activity and cortical microcirculation revealed by imaging spectroscopy: implications for functional brain mapping. Science 272(5261):551-554.
Mandeville J, Marota J, Keltner J, Kosovsky B, Burke J, al e (1996). CBV functional imaging in rat brain using iron oxide agent at steady state concentration. Annual Meeting of the International Society of Magnetic Resonance in Medicine, New York, New York.
Mandeville JB, Jenkins BG, Chen YC, Choi JK, Kim YR, Belen D, Liu C, Kosofsky BE, Marota JJ (2004) Exogenous contrast agent improves sensitivity of gradient-echo functional magnetic resonance imaging at 9.4 T. Magn Reson Med 52(6):1272-1281.
Mandeville JB, Jenkins BG, Kosofsky BE, Moskowitz MA, Rosen BR, Marota JJ (2001) Regional sensitivity and coupling of BOLD and CBV changes during stimulation of rat brain. Magn Reson Med 45(3):443-447.
Mandeville JB, Marota JJ (1999) Vascular filters of functional MRI: spatial localization using BOLD and CBV contrast. Magn Reson Med 42(3):591-598.
Mandeville JB, Marota JJ, Kosofsky BE, Keltner JR, Weissleder R, Rosen BR, Weisskoff RM (1998) Dynamic functional imaging of relative cerebral blood volume during rat forepaw stimulation. Magn Reson Med 39(4):615-624.
Mansfield P (1977) Multi-planar image formation using NMR spin echoes. J Phys C 10:L55-L58.
Mansfield P, Coxon R, Glover P (1994a) Echo-planar imaging of the brain at 3.0 T: first normal volunteer results. Journal of computer assisted tomography 18(3):339-343.
Mansfield P, Harvey PR, Stehling MK (1994b) Echo-volumar imaging. MAGMA 2:291-294.
Marckmann P, Skov L, Rossen K, Dupont A, Damholt MB, Heaf JG, Thomsen HS (2006) Nephrogenic systemic fibrosis: suspected causative role of gadodiamide used for contrast-enhanced magnetic resonance imaging. Journal of the American Society of Nephrology : JASN 17(9):2359-2362.
McKinnon GC (1993) Ultrafast interleaved gradient-echo-planar imaging on a standard scanner. Magn Reson Med 30:609.
Menon RS, Ogawa S, Strupp JP, Ugurbil K (1997) Ocular dominance in human V1 demonstrated by functional magnetic resonance imaging. J Neurophysiol 77(5):2780-2787.
Menon RS, Ogawa S, Tank DW, Ugurbil K (1993) 4 Tesla gradient recalled echo characteristics of photic stimulation- induced signal changes in the human primary visual cortex. Magn Reson Med 30(3):380-386.
Metzger GJ, Snyder C, Akgun C, Vaughan T, Ugurbil K, Van de Moortele PF (2008) Local B1+ shimming for prostate imaging with transceiver arrays at 7T based on subject-dependent transmit phase measurements. Magn Reson Med 59(2):396-409.
Michaeli S, Garwood M, Zhu XH, DelaBarre L, Andersen P, Adriany G, Merkle H, Ugurbil K, Chen W (2002) Proton T(2) relaxation study of water, N-acetylaspartate, and creatine in human brain using Hahn and Carr-Purcell spin echoes at 4T and 7T. Magn Reson Med 47(4):629-633.
Mitra PP, Ogawa S, Hu X, Ugurbil K (1997) The nature of spatiotemporal changes in cerebral hemodynamics as manifested in functional magnetic resonance imaging. Magn Reson Med 37(4):511-518.
Mitra PP, Pesaran B (1999) Analysis of Dynamic Brain Imaging Data. Biophys J. 76(2):691-708.
Mitra PP, Thompson DJ, Ogawa S, Hu X, Ugurbil K (1995) Spatio-temporal Patterns in fMRI Data Revealed by Principal Component Analysis and Subsequent Low Pass Filtering. Proc. Int. Soc. Mag Reson Med 2:817.
Miyawaki Y, Uchida H, Yamashita O, Sato MA, Morito Y, Tanabe HC, Sadato N, Kamitani Y (2008) Visual image reconstruction from human brain activity using a combination of multiscale local image decoders. Neuron 60(5):915-929.
Moeller S, Auerbach E, van de Moortele P-F, Adriany G, Ugurbil K (2008) fMRI with 16 fold reduction using multibanded multislice sampling. Proc. Int. Soc. Magn. Reson. in Med. 16:2366.
Moeller S, Van de Moortele PF, Goerke U, Adriany G, Ugurbil K (2006) Application of parallel imaging to fMRI at 7 Tesla utilizing a high 1D reduction factor. Magn Reson Med 56(1):118-129.
Moeller S, Yacoub E, Olman CA, Auerbach E, Strupp J, Harel N, Ugurbil K (2010) Multiband multislice GE-EPI at 7 tesla, with 16-fold acceleration using partial parallel imaging with application to high spatial and temporal whole-brain fMRI. Magn Reson Med 63(5):1144-1153.
Naselaris T, Kay KN, Nishimoto S, Gallant JL (2011) Encoding and decoding in fMRI. Neuroimage 56(2):400-410.
Naselaris T, Prenger RJ, Kay KN, Oliver M, Gallant JL (2009) Bayesian reconstruction of natural images from human brain activity. Neuron 63(6):902-915.
Norris DG, Zysset S, Mildner T, Wiggins CJ (2002) An investigation of the value of spin-echo-based fMRI using a Stroop color-word matching task and EPI at 3 T. Neuroimage 15(3):719-726.
Nunes RG, Hajnal JV, Golay X, Larkman DJ (2006) Simultaneous slice excitation and reconstruction for single shot EPI. Proc. Int. Soc. Mag Reson Med 14:293.
Ogawa S, Lee T-M, Kay AR, Tank DW (1990a) Brain Magnetic Resonance Imaging with Contrast Dependent on Blood Oxygenation. Proc Natl Acad Sci USA 87:9868-9872.
Ogawa S, Lee T-M, Nayak AS, Glynn P (1990b) Oxygenation-sensitive contrast in magnetic resonance image of rodent brain at high magnetic fields. Magn Reson Med 14:68-78.
Ogawa S, Lee TM (1990) Magnetic Resonance Imaging of Blood Vessels at High Fields: in Vivo and in Vitro Measurments and Image Simulation. Magn Reson Med 16:9-18.
Ogawa S, Menon RS, Tank DW, Kim S-G, Merkle H, Ellermann JM, Ugurbil K (1993) Functional Brain Mapping by Blood Oxygenation Level-Dependent Contrast Magnetic Resonance Imaging. Biophys J 64:800-812.
Ogawa S, Mitra PP, Hu X, Ugurbil K (1996). Spatio-temporal patterns revealed in denoised fMRI Data. Visualization of information processing in the human brain:. Recent advances in MEG and functional MRI. I. Hashimoto, Y. C. Okada and S. Ogawa, EEG Suppl 47:5-14.
Ogawa S, Tank DW, Menon R, Ellermann JM, Kim SG, Merkle H, Ugurbil K (1992) Intrinsic signal changes accompanying sensory stimulation: functional brain mapping with magnetic resonance imaging. Proceedings of the National Academy of Sciences of the United States of America 89(13):5951-5955.
Ohliger MA, Grant AK, Sodickson DK (2003) Ultimate intrinsic signal-to-noise ratio for parallel MRI: electromagnetic field considerations. Magn Reson Med 50(5):1018-1030.
Olman CA, Harel N, Feinberg DA, He S, Zhang P, Ugurbil K, Yacoub E (2012) Differential layer-specific fMRI provides evidence of neuronal computations in human V1. Plos One (in final revision)
Olman CA, Van de Moortele PF, Schumacher JF, Guy JR, Ugurbil K, Yacoub E (2010) Retinotopic mapping with spin echo BOLD at 7T. Magn Reson Imaging 28(9):1258-1269.
Parkes LM, Schwarzbach JV, Bouts AA, Deckers RH, Pullens P, Kerskens CM, Norris DG (2005) Quantifying the spatial resolution of the gradient echo and spin echo BOLD response at 3 Tesla. Magn Reson Med 54(6):1465-1472.
Pfeuffer J, Van De Moortele PF, Ugurbil K, Hu X, Glover GH (2002) Correction of physiologically induced global off-resonance effects in dynamic echo-planar and spiral functional imaging. Magn Reson Med 47(2):344-353.
Pohmann R, Budde J, Auerbach EJ, Adriany G, Ugurbil K (2010) Theoretical and experimental evaluation of continuous arterial spin labeling techniques. Magn Reson Med 63(2):438-446.
Polimeni JR, Fischl B, Greve DN, Wald LL (2010) Laminar analysis of 7T BOLD using an imposed spatial activation pattern in human V1. Neuroimage 52(4):1334-1346.
Poser BA, Koopmans PJ, Witzel T, Wald LL, Barth M (2010) Three dimensional echo-planar imaging at 7 Tesla. Neuroimage 51(1):261-266.
Poser BA, Norris DG (2009) Investigating the benefits of multi-echo EPI for fMRI at 7 T. Neuroimage 45(4):1162-1172.
Pruessmann KP, Weiger M, Scheidegger MB, Boesiger P (1999) SENSE: sensitivity encoding for fast MRI. Magn Reson Med 42(5):952-962.
Raichle ME (1987). Circulatory and metabolic correlates of brain function in normal humans. Handbook of Physiology-The Nervous System. F. Plum, Am. Phys. Soc., Bethesda. vol. V:643-674.
Raichle ME (2009) A brief history of human brain mapping. Trends in neurosciences 32(2):118-126.
Rooney WD, Johnson G, Li X, Cohen ER, Kim SG, Ugurbil K, Springer CS, Jr. (2007) Magnetic field and tissue dependencies of human brain longitudinal 1H2O relaxation in vivo. Magn Reson Med 57(2):308-318.
Segebarth C, Belle V, Delon C, Massarelli R, Decety J, Le Bas JF, Decorps M, Benabid AL (1994) Functional MRI of the human brain: predominance of signals from extracerebral veins. Neuroreport 5(7):813-816.
Sereno MI, Dale AM, Reppas JB, Kwong KK, Belliveau JW, Brady TJ, Rosen BR, Tootell RBH (1995) Borders of Multiple Visual Areas in Humans Revealed by Functional Magnetic Resonance Imaging. Science 268:889-893.
Setsompop K, Alagappan V, Gagoski B, Witzel T, Polimeni J, Potthast A, Hebrank F, Fontius U, Schmitt F, Wald LL, Adalsteinsson E (2008a) Slice-selective RF pulses for in vivo B1+ inhomogeneity mitigation at 7 tesla using parallel RF excitation with a 16-element coil. Magn Reson Med 60(6):1422-1432.
Setsompop K, Alagappan V, Gagoski BA, Potthast A, Hebrank F, Fontius U, Schmitt F, Wald LL, Adalsteinsson E (2009) Broadband slab selection with B1+ mitigation at 7T via parallel spectral-spatial excitation. Magn Reson Med 61(2):493-500.
Setsompop K, Alagappan V, Zelinski AC, Potthast A, Fontius U, Hebrank F, Schmitt F, Wald LL, Adalsteinsson E (2008b) High-flip-angle slice-selective parallel RF transmission with 8 channels at 7 T. J Magn Reson 195(1):76-84.
Setsompop K, Gagoski BA, Polimeni JR, Witzel T, Wedeen VJ, Wald LL (2011) Blipped-controlled aliasing in parallel imaging for simultaneous multislice echo planer imaging with reduced g-factor penalty. Magn Reson Med.
Setsompop K, Wald LL, Alagappan V, Gagoski BA, Adalsteinsson E (2008c) Magnitude least squares optimization for parallel radio frequency excitation design demonstrated at 7 Tesla with eight channels. Magn Reson Med 59(4):908-915.
Sheth S, Nemoto M, Guiou M, Walker M, Pouratian N, Toga AW (2003) Evaluation of coupling between optical intrinsic signals and neuronal activity in rat somatosensory cortex. Neuroimage 19(3):884-894.
Shmuel A, Chaimow D, Raddatz G, Ugurbil K, Yacoub E (2010) Mechanisms underlying decoding at 7 T: ocular dominance columns, broad structures, and macroscopic blood vessels in V1 convey information on the stimulated eye. Neuroimage 49(3):1957-1964.
Shmuel A, Yacoub E, Chaimow D, Logothetis NK, Ugurbil K (2007) Spatio-temporal point-spread function of fMRI signal in human gray matter at 7 Tesla. Neuroimage 35(2):539-552.
Silva AC, Lee SP, Iadecola C, Kim SG (2000) Early temporal characteristics of cerebral blood flow and deoxyhemoglobin changes during somatosensory stimulation. J Cereb Blood Flow Metab 20(1):201-206.
Silvennoinen MJ, Clingman CS, Golay X, Kauppinen RA, van Zijl PC (2003) Comparison of the dependence of blood R2 and R2* on oxygen saturation at 1.5 and 4.7 Tesla. Magn Reson Med 49(1):47-60.
Smirnakis SM, Schmid MC, Weber B, Tolias AS, Augath M, Logothetis NK (2007) Spatial specificity of BOLD versus cerebral blood volume fMRI for mapping cortical organization. Journal of cerebral blood flow and metabolism : official journal of the International Society of Cerebral Blood Flow and Metabolism 27(6):1248-1261.
Smith SM, Miller KL, Moeller S, Xu J, Auerbach EJ, Woolrich MW, Beckmann CF, Jenkinson M, Andersson J, Glasser MF, Van Essen DC, Feinberg DA, Yacoub ES, Ugurbil K (2012) Temporally-independent functional modes of spontaneous brain activity. Proc Natl Acad Sci U S A: Published online before print February 7, 2012, doi: 2010.1073/pnas.1121329109.
Sodickson DK, Griswold MA, Jakob PM (1999) SMASH imaging. Magn Reson Imaging Clin N Am 7(2):237-254, vii-viii.
Spees WM, Yablonskiy DA, Oswood MC, Ackerman JJ (2001) Water proton MR properties of human blood at 1.5 Tesla: magnetic susceptibility, T(1), T(2), T*(2), and non-Lorentzian signal behavior. Magnetic resonance in medicine: official journal of the Society of Magnetic Resonance in Medicine / Society of Magnetic Resonance in Medicine 45(4):533-542.
Springer CS, Xu Y (1991). Aspects of Bulk Magnetic Susceptibility in in vivo MRI and MRS. New Developments in Contrast Agent Research. P. A. Rink and R. N. Muller. Blonay, Switzerland, European Magnetic Resonance Forum:13-25.
Stab D, Ritter CO, Breuer FA, Weng AM, Hahn D, Kostler H (2011) CAIPIRINHA accelerated SSFP imaging. Magnetic resonance in medicine : official journal of the Society of Magnetic Resonance in Medicine / Society of Magnetic Resonance in Medicine 65(1):157-164.
Stringer EA, Chen LM, Friedman RM, Gatenby C, Gore JC (2011) Differentiation of somatosensory cortices by high-resolution fMRI at 7 T. Neuroimage 54(2):1012-1020.
Sun P, Ueno K, Waggoner RA, Gardner JL, Tanaka K, Cheng K (2007) A temporal frequency-dependent functional architecture in human V1 revealed by high-resolution fMRI. Nat Neurosci 10(11):1404-1406.
Thirion B, Duchesnay E, Hubbard E, Dubois J, Poline JB, Lebihan D, Dehaene S (2006) Inverse retinotopy: inferring the visual content of images from brain activation patterns. Neuroimage 33(4):1104-1116.
Thulborn KR, Waterton JC, Matthews PM, Radda GK (1982) Oxygenation dependence of the transverse relaxation time of water protons in whole blood at high field. Biochim Biophys Acta 714(2):265-270.
Tsekos NV, Zhang F, Merkle H, Nagayama M, Iadecola C, Kim SG (1998) Quantitative measurements of cerebral blood flow in rats using the FAIR technique: correlation with previous iodoantipyrine autoradiographic studies. Magn Reson Med 39(4):564-573.
Ugurbil K, Adriany G, Andersen P, Chen W, Garwood M, Gruetter R, Henry PG, Kim SG, Lieu H, Tkac I, Vaughan T, Van De Moortele PF, Yacoub E, Zhu XH (2003a) Ultrahigh field magnetic resonance imaging and spectroscopy. Magn Reson Imaging 21(10):1263-1281.
Ugurbil K, Adriany G, Andersen P, Chen W, Gruetter R, Hu X, Merkle H, Kim DS, Kim SG, Strupp J, Zhu XH, Ogawa S (2000a) Magnetic resonance studies of brain function and neurochemistry. Annu Rev Biomed Eng 2:633-660.
Ugurbil K, Chen W, Hu X, Kim S-G, Ogawa S, Zhu X-H (2000b). Functional MRI at High Fields: Practice and Utility. Methods in Biomedical Magnetic Resonance Imaging and Spectroscopy. I. Yong, John Wiley and Sons Ltd, Chichester, UK:603-623.
Ugurbil K, Hu X, Chen W, Zhu XH, Kim SG, Georgopoulos A (1999a) Functional mapping in the human brain using high magnetic fields. Philos Trans R Soc Lond B Biol Sci 354(1387):1195-1213.
Ugurbil K, Ogawa S, Kim S-G, Hu X, Chen W, Zhu X-H (1999b). Imaging brain activity using nuclear spins. Magnetic Resonance and Brain Function. B. Maraviglia. Amsterdam, Societa Italiana di Fisica and IOS Press. course XXXIX.:261-301.
Ugurbil K, Toth L, Kim DS (2003b) How accurate is magnetic resonance imaging of brain function? Trends Neurosci 26(2):108-114.
Uludag K, Muller-Bierl B, Ugurbil K (2009) An integrative model for neuronal activity-induced signal changes for gradient and spin echo functional imaging. Neuroimage 48(1):150-165.
Van de Moortele PF, Akgun C, Adriany G, Moeller S, Ritter J, Collins CM, Smith MB, Vaughan JT, Ugurbil K (2005) B(1) destructive interferences and spatial phase patterns at 7 T with a head transceiver array coil. Magn Reson Med 54(6):1503-1518.
Van de Moortele PF, Auerbach EJ, Olman C, Yacoub E, Ugurbil K, Moeller S (2009) T1 weighted brain images at 7 Tesla unbiased for Proton Density, T2* contrast and RF coil receive B1 sensitivity with simultaneous vessel visualization. Neuroimage 46(2):432-446.
Van De Moortele PF, Pfeuffer J, Glover GH, Ugurbil K, Hu X (2002) Respiration-induced B0 fluctuations and their spatial distribution in the human brain at 7 Tesla. Magn Reson Med 47(5):888-895.
van der Zwaag W, Francis S, Head K, Peters A, Gowland P, Morris P, Bowtell R (2009a) fMRI at 1.5, 3 and 7 T: characterising BOLD signal changes. Neuroimage 47(4):1425-1434.
van der Zwaag W, Marques JP, Hergt M, Gruetter R (2009b) Investigation of high-resolution functional magnetic resonance imaging by means of surface and array radiofrequency coils at 7 T. Magnetic Resonance Imaging 27(8):1011-1018.
van der Zwaag W, Marques JP, Kober T, Glover G, Gruetter R, Krueger G (2011) Temporal SNR characteristics in segmented 3D-EPI at 7T. Magnetic resonance in medicine : official journal of the Society of Magnetic Resonance in Medicine / Society of Magnetic Resonance in Medicine.
van Zijl PC, Eleff SM, Ulatowski JA, Oja JM, Ulug AM, Traystman RJ, Kauppinen RA (1998) Quantitative assessment of blood flow, blood volume and blood oxygenation effects in functional magnetic resonance imaging [see comments]. Nat Med 4(2):159-167.
Vanzetta I, Slovin H, Omer DB, Grinvald A (2004) Columnar resolution of blood volume and oximetry functional maps in the behaving monkey; implications for FMRI. Neuron 42(5):843-854.
Vaughan T, DelaBarre L, Snyder C, Tian J, Akgun C, Shrivastava D, Liu W, Olson C, Adriany G, Strupp J, Andersen P, Gopinath A, van de Moortele PF, Garwood M, Ugurbil K (2006) 9.4T human MRI: preliminary results. Magn Reson Med 56(6):1274-1282.
Wang G, Tanaka K, Tanifuji M (1996) Optical imaging of functional organization in the monkey inferotemporal cortex. Science 272:1665-1668.
Weisskoff RM, Zuo CS, Boxerman JL, Rosen BR (1994) Microscopic susceptibility variation and transverse relaxation: theory and experiment. Magn Reson Med 31(6):601-610.
Wielopolski PA, Manning WJ, Edelman RR (1995) Single breath-hold volumetric imaging of the heart using magnetization-prepared 3-dimensional segmented echo planar imaging. Journal of magnetic resonance imaging : JMRI 5(4):403-409.
Wiesinger F, Van de Moortele PF, Adriany G, De Zanche N, Ugurbil K, Pruessmann KP (2004) Parallel imaging performance as a function of field strength--an experimental investigation using electrodynamic scaling. Magn Reson Med 52(5):953-964.
Wiesinger F, Van de Moortele PF, Adriany G, De Zanche N, Ugurbil K, Pruessmann KP (2006) Potential and feasibility of parallel MRI at high field. NMR Biomed 19(3):368-378.
Wong EC, Buxton RB, Frank LR (1998) Quantitative imaging of perfusion using a single subtraction (QUIPSS and QUIPSS II). Magn Reson Med 39(5):702-708.
Wong EC, Cronin M, Wu WC, Inglis B, Frank LR, Liu TT (2006) Velocity-selective arterial spin labeling. Magnetic resonance in medicine: official journal of the Society of Magnetic Resonance in Medicine / Society of Magnetic Resonance in Medicine 55(6):1334-1341.
Wu WC, Wong EC (2006) Intravascular effect in velocity-selective arterial spin labeling: the choice of inflow time and cutoff velocity. Neuroimage 32(1):122-128.
Wu WC, Wong EC (2007) Feasibility of velocity selective arterial spin labeling in functional MRI. Journal of cerebral blood flow and metabolism : official journal of the International Society of Cerebral Blood Flow and Metabolism 27(4):831-838.
Xu J, Moeller S, Strupp J, Auerbach E, Chen L, Feinberg D, Ugurbil K, Yacoub E (2012) Highly accelerated whole Brain Imaging Using Aligned-Blipped-Controlled Aliasing Multiband EPI. Proc. Int. Soc. Mag Reson Med.
Yablonskiy DA, Haacke EM (1994) Theory of NMR signal behavior in magnetically inhomogeneous tissues: the static dephasing regime. Magn Reson Med 32(6):749-763.
Yacoub E, Duong TQ, Van De Moortele PF, Lindquist M, Adriany G, Kim SG, Ugurbil K, Hu X (2003) Spin-echo fMRI in humans using high spatial resolutions and high magnetic fields. Magn Reson Med 49(4):655-664.
Yacoub E, Harel N, Ugurbil K (2008) High-field fMRI unveils orientation columns in humans. Proc Natl Acad Sci U S A 105(30):10607-10612.
Yacoub E, Shmuel A, Logothetis N, Ugurbil K (2007) Robust detection of ocular dominance columns in humans using Hahn Spin Echo BOLD functional MRI at 7 Tesla. Neuroimage 37(4):1161-1177.
Yacoub E, Shmuel A, Pfeuffer J, Van De Moortele PF, Adriany G, Andersen P, Vaughan JT, Merkle H, Ugurbil K, Hu X (2001) Imaging brain function in humans at 7 Tesla. Magn Reson Med 45(4):588-594.
Yacoub E, Van De Moortele PF, Shmuel A, Ugurbil K (2005) Signal and noise characteristics of Hahn SE and GE BOLD fMRI at 7 T in humans. Neuroimage 24(3):738-750.
Yang Y, Glover GH, van Gelderen P, Patel AC, Mattay VS, Frank JA, Duyn JH (1998) A comparison of fast MR scan techniques for cerebral activation studies at 1.5 tesla [published erratum appears in Magn Reson Med 1998 Mar;39(3):following 505]. Magn Reson Med 39(1):61-67.
Yutzy SR, Seiberlich N, Duerk JL, Griswold MA (2011) Improvements in multislice parallel imaging using radial CAIPIRINHA. Magnetic resonance in medicine : official journal of the Society of Magnetic Resonance in Medicine / Society of Magnetic Resonance in Medicine 65(6):1630-1637.
Zhang W, Williams DS, Koretsky AP (1993) Measurement of rat brain perfusion by NMR using spin labeling of arterial water: in vivo determination of the degree of spin labeling. Magn Reson Med 29(3):416-421.
Zhao F, Jin T, Wang P, Hu X, Kim SG (2007) Sources of phase changes in BOLD and CBV-weighted fMRI. Magn Reson Med 57(3):520-527.
Zhao F, Wang P, Hendrich K, Kim SG (2005) Spatial specificity of cerebral blood volume-weighted fMRI responses at columnar resolution. Neuroimage 27(2):416-424.
Zhao F, Wang P, Hendrich K, Ugurbil K, Kim SG (2006) Cortical layer-dependent BOLD and CBV responses measured by spin-echo and gradient-echo fMRI: insights into hemodynamic regulation. Neuroimage 30(4):1149-1160.
Zimmermann J, Goebel R, De Martino F, van de Moortele PF, Feinberg D, Adriany G, Chaimow D, Shmuel A, Ugurbil K, Yacoub E (2011) Mapping the Organization of Axis of Motion Selective Features in Human Area MT Using High-Field fMRI. PLoS ONE 6(12):e28716.