
BUILDING LAYOUTS AS COGNITIVE DATA: PURVIEW AND PURVIEW INTERFACE
Accepted October 1, 2012
Keywords
architecture, buildings, layouts, cognitive maps
Abstract
This paper offers a computational description and provisional statistical profile of properties of building layouts that contribute to making them intelligible. Buildings are arrangements of boundaries that demarcate interior space according to the organization of human life and activity. At the same time a building is usually a continuously connected interior. Thus, the implicit question addressed in practice by the design of every building layout is as follows: how can spatial demarcation and differentiation be consistent with our capacity to cognitively map a building as a whole? Everyday experience suggests that spaces with characteristic names such as corridors, courtyards, atria, halls and hallways act as references. They provide us with a more expansive visual field than the rooms devoted to particular uses; more importantly, they often afford an overview of the connections to adjoining spaces. This is generalized by the idea of the purview interface: the interface between ordinary spaces confining perception to a limited part of the interior, and prominent spaces providing overview not only of area but also of connections. The purview interface can function as a rudimentary foundation of layout intelligibility. I show that prominent overview spaces are strategically distributed so that all other spaces are only very few visual turns away from the nearest overview space. The strategic distribution of overview spaces limits the minimum number of turns around corners that are necessary in order to move between any two spaces in the building. This affords anchoring cognitive maps on overview spaces which can act as effective references when navigating between any two spaces.
Introduction
Of all human artifacts, buildings stand out by providing frameworks within which the questions where am I?, where are other people? and where are things? are answerable. Surely, we stand in front or behind, to one side or the other, above or below, uphill or downhill a building, a tree or a bicycle. We stand between or are surrounded by buildings as easily as we stand between or are surrounded by chairs. We go in and out of buildings or rooms in buildings as we take things in and out of boxes, or as we move in and out of a gathering. Buildings, however, create relatively complex and permanent arrangements of space which function as stable allocentric frameworks for locating ourselves, other people, and things as we go about our daily lives. More importantly, this is one of their fundamental generic functions. Buildings demarcate space according to the organization of human life and activity, but they must do so while still affording cognitive maps of such organization. By implication, building designs can be analyzed as cognitive data, to reveal fundamental parameters of our understanding of space.
To pose this question implies no naïve social assumption. Without a doubt, most building types are associated with socially defined categories of users. Some categories do not have access to the premises as a whole. Similarly, users cast in certain roles may lack the motivation to construct a coherent global cognitive map. For example, the patrons of a theater do not usually enter backstage spaces, and the patients of a hospital are guided or escorted to only a small selection of the available rooms. Buildings are also associated with the performance of organizational roles which frame the understanding of space (Rosano and Reardon 1999). A museum guard is sensitive to the patterns of visibility afforded by the layout since these affect the capacity to survey. Judges are sensitive to the way in which courtroom design frames intersecting lines of sight between their bench, the accused, the jury, the legal teams and the public seats. However, for at least some users, and where applicable, for their designers and facility managers, buildings must make sense as a whole. Most of the time what counts as a whole building is intuitively obvious; the presence of a continuously connected interior is an important factor. There are times when the definition of the boundaries of a building may require more scrutiny, taking into account effective patterns of social use. There is no reason to suppose that the principles which make buildings intelligible as a whole differ from those that make them intelligible in their parts, according to various routines and roles. From a methodological point of view, answering the larger question, how can buildings be intelligible as wholes? is likely to facilitate, if not subsume, answering the lesser question, how can buildings be intelligible in their parts?
In this paper I review and propose some foundations for this work on the basis of a sample of 67 building floor plans. The sample, described in Table 1, includes building floors of different sizes (areas vary from 112m2 to 17788m2), a variety of function types (including hospitals, museums, offices, schools, libraries, government, religious and residential buildings and others), a variety of backgrounds (from vernacular house clusters in Ghana to recent museums designed by star-architects), and a variety of historic periods (from Mycenaean palaces to projects still under construction). The drawings are allowed to define the continuously connected whole in each case. While the sample is not random or representative of the population of building layouts in any systematic way, it is inclusive enough to support the pilot study of the generic properties of layouts that will be presented below.
My analysis is motivated by the desire to bridge between research in architecture and in cognitive psychology. The latter asks what properties of environment are relevant affordances with respect to human behavior and its cognitive or perceptual underpinnings. The former asks what is possible, viable and interesting in design. Identifying and learning to describe the generic properties of layouts that are important to the cognitive and organizational performance of buildings is a question of common interest. Indeed, design is not framed by mathematical and physical possibility alone, but also by constraints which arise from the generic human functions and human performance considerations that buildings respond to. Conversely, the properties of buildings that are related to their generic cognitive functions are of interest to psychology, even if, perhaps, under-investigated.
My analysis is informed by prior research findings using similar methods to describe buildings. The connectivity of hospital circulation spaces studied in terms of the changes of direction that are needed to move from any position in a layout to any other influences navigation, including open-ended exploration and goal-oriented wayfinding (Peponis et al. 1990; Haq 2003). In museums, circulation lines which are fewer turns away from all exhibition spaces draw more visitors to them, even though visitors are more likely to return to circulation lines which directly intersect a greater number of other circulation lines (Choi 1999). While people unfamiliar with a large, complex hospital environment might initially direct their paths to spaces with more direct connections, the gravitation towards spaces that are better connected to a layout as a whole develops relatively easily (Haq and Zimring 2003). The lack of traversing corridors hinders the development of survey knowledge (Moeser 1988), and the misalignment of corridors impairs wayfinding (Werner and Schindler 2004). These studies suggest that the direction turns involved in movement affect the legibility of layouts and navigation through them. Other studies highlight the importance of the immediate visual field available from a position. Thus, visitors entering open plan exhibition settings are more likely to come near and be exposed to exhibits that are associated with larger visibility and access polygons (Peponis et al. 2004). Nurses in an intensive care unit are more likely to stand and talk to one another in positions from which they can see more patients, while doctors are likely to stand and talk in positions which afford better views of the general surrounding environment (Lu and Zimring 2011).
Most of these studies are based on very small samples of buildings, sometimes a single building. One of their significant contributions is the demonstration that more sophisticated and consistently applicable methods for describing layouts are relevant to testing hypotheses regarding spatial cognition. In this paper, I will change the emphasis. Rather than asking how a measurable property of layouts impacts a cognitive function, I will take a step back and ask how layouts vary based on the kinds of properties that are associated with cognitive and organizational performance. In doing this, I will retrace the theoretical foundations of the descriptive methods involved. To some extent this is a matter of seeking appropriate simplification. More importantly, it is a matter of disentangling issues and clarifying how progressively more complex descriptions can be built from first principles and parsimonious assumptions. These issues will be discussed in the final section of the paper.
Step, purview, interface and the relational analysis of layouts
Step, or walking distance, and direct purview, or visible area, are fundamental to our experience of space as we move. By step I refer to our experience of space in terms of Euclidian metric distances to be traversed through movement. We can analyze space in terms of step by applying a metric to describe path-distance from any potentially occupied position to all other available positions. By direct purview I refer to our ability to survey available space through sight. Direct purview, however, is not a matter of visibility alone. Most often what is visible is also accessible, directly or indirectly, and thus can potentially be occupied by us or others. To have purview over space means to be able to judge space as a potential field of access, movement, search, encounter, and co-presence.
The analysis of isovists or visibility polygons introduced by Benedikt (1979) is directly relevant to the study of purview, with the important caveat that lines of sight are also typically lines of access; therefore, the relations described are generally relations of actual visibility and possible access, unless particular modifying circumstances apply. Measuring space in terms of area or other properties of visibility polygons, however, does not suffice, because the measures take into account only the purview that is directly available from a position, and ignore other available area which is around a corner or through the occluding edges of the visual field. In order to generalize the idea of purview, we can describe the relationship of a position to all others according to the mean minimum number of turns that are required to reach them. This is consistent with the general approach adopted in space syntax (Hillier and Hanson 1984; Hillier 1996; Peponis and Wineman 2002)1. Thus, we have local (direct purview measured in square meters) and global (mean turns) measures of purview. The former capture what is immediately available to perception. The latter capture an objective property that can be inferred from repeated trajectories of perception over time as they inform cognitive schemata. Figure 1 illustrates direct purview (1.1 and 1.2) and global purview (1.3) from one position in the Barcelona Pavilion.
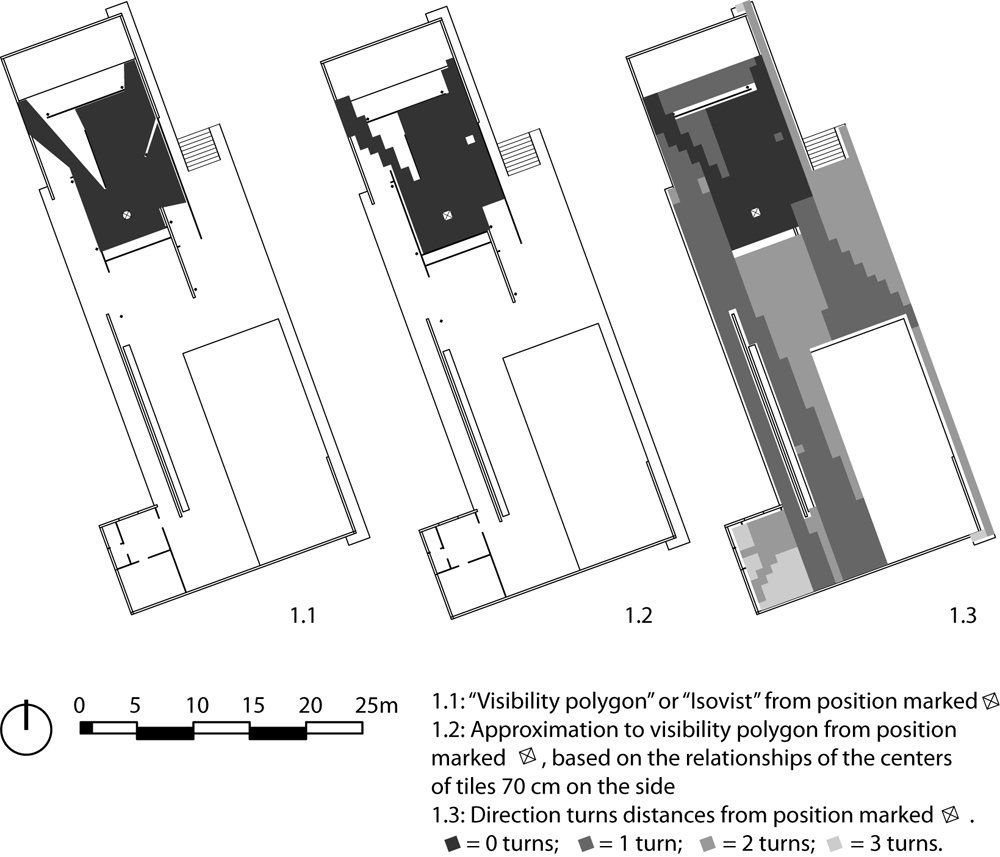
Figure 1: Graphic definition of visibility polygons and direction turns from a position in a building
These ideas will be introduced through example. However, some considerations must be addressed beforehand. Building premises are arrangements of continuously connected space. To be sure, doors imply partitions of interior space. For the purposes of studying layouts as a whole, however, it makes sense to assume all internal doors are open and that all interior space is accessible. In this way, we establish a consistent way of defining what counts as available area, in the knowledge that areas which are socially or programmatically available to particular categories of users will be subsets of the total area, whether with empty or non-empty intersections.
In order to describe layouts in terms of spatial relationships we must produce some form of discretization of continuous space into constituent elements. The natural inclination to describe the spatial relationships between rooms must be resisted. As shown in Figure 2, although in some cases rooms are indeed easily identifiable, in others they are not. Thus, in Villa Rotonda, Figure 2.1, there is little doubt as to the partition of space into rooms. In the case of the vernacular compound in Nangodi, Figure 2.2, primary rooms are well defined, but the open left-over space forms a continuum that cannot readily be partitioned into larger discrete elements. Finally, the design of the Barcelona Pavilion, Figure 2.3, defies the identification of rooms. This is the purpose of the free plan which the Pavilion historically exemplifies. It is, therefore, important that a method of analysis be available which can be consistently applied to all cases, without depending on any assumption about higher order discretization of the spatial continuum.
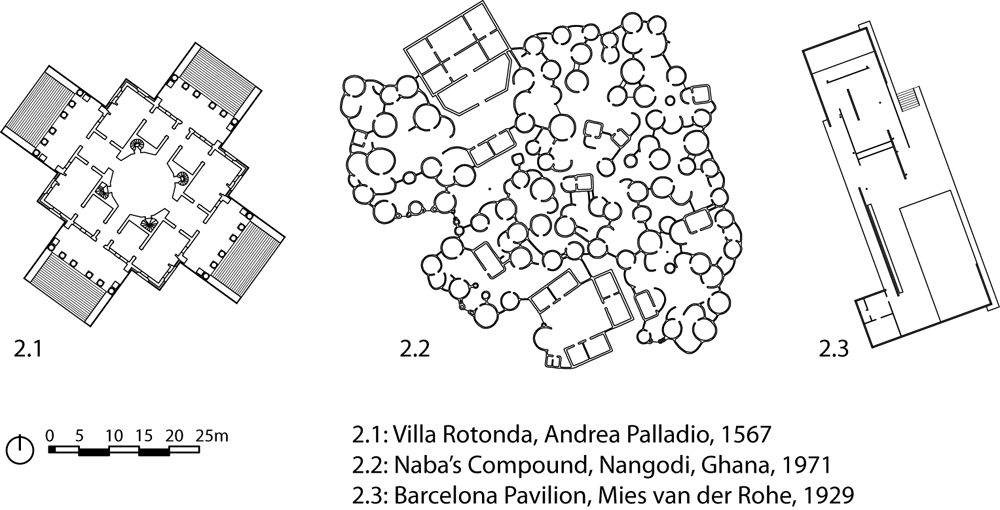
Figure 2: Three building layouts
Here all layouts are covered by a uniform grid of points, each treated as the center of a tessellation of square tiles of 0.70m on the side. The tiles represented by the points can be seen as units of available space. For example, 0.49m2 is a good representation of the area occupied by a person standing (Sliwa and Fairweather 1970). The tessellation is oriented so as to correspond to the prevailing orientation of layout edges and walls. For the purposes of analysis of purview, two tiles are taken to be connected when the line that joins their centers does not intersect a boundary. Connection refers to visibility and access indiscriminately. In other words, all boundaries which block movement have been interpreted as also blocking view. The analysis can be refined to include a separate treatment of all visual connections. By definition, connections of visibility and access are a subset of all visual connections. However, since visual connections which are not also connections of access are not common in building history, the simple analysis pursued here is pertinent. For the purposes of analysis of distance, the relation of any two tiles is indexed by the shortest available path that connects their centers. Because layouts involve discontinuities arising from deformations of perimeter shape or from internal partitions, the shortest available path will often exceed in length the straight line connecting the centroids of the tiles. Path elongation is measured by the difference between shortest available path and straight line path as a proportion of straight line path.
With these preliminaries out of the way, some examples of analysis can be introduced in order to clarify the nature of relations of purview, metric distance, and turns distance in buildings. UCL DepthMap is used for the analysis. The software was developed by Alasdair Turner (Turner et al. 2001; 2005) and is the pre-eminent tool used in the field of space syntax. Where variable names or interpretations differ from those embedded in DepthMap, the technical difference and explanation will be provided.
The Tholos and Attalos Stoa of Athens are suitable elementary examples to introduce general ideas. Figure 3 shows that in both cases the mean path distance from each tile to all other tiles falls gradually from a central area towards the edges. The distance distribution is flat for the Tholos and positively skewed unimodal for the Attalos Stoa. The connectivity of each tile is more evenly distributed over the entire area of the Tholos, and forms two relatively uniform bands in the Attalos Stoa, giving rise to a clearly bi-modal distribution. DepthMap measures connectivity by the number of connected tiles and this is the measure shown in Figure 3. In the subsequent analysis, connectivity will be transformed into an approximate measure of visible area, or direct purview, by taking into account the size of a tile2.
Two important and simple principles are demonstrated by the analysis of the two elementary buildings. First, while the metric distance from an occupied tile to all others is inelastic (it can only change gradually as we consider any two adjoining tiles), connectivity (direct purview) is elastic (it can remain relatively constant as we consider adjoining tiles that lie within the same convex hull but changes abruptly as we consider neighboring tiles around a corner). The elasticity of purview as compared to distance is fundamental to the way in which buildings are perceived and understood.
Second, as buildings get subdivided, perceptual-spatial interfaces are created, as shown in the Attalos Stoa. The word interface is used to describe sharply differentiated perceptual conditions brought into a direct relationship, for example, the rooms with restricted direct purview and the main aisles with expansive direct purview. An interface is not the same as a threshold. A threshold, as normally defined, is a transition zone between two individual spaces; each room of the Attalos Stoa has its own threshold. An interface, in the sense in which the word is used here, can be defined across multiple locations distributed over a design as a whole. The idea of interface describes a recurrent rather than a fully localized condition.
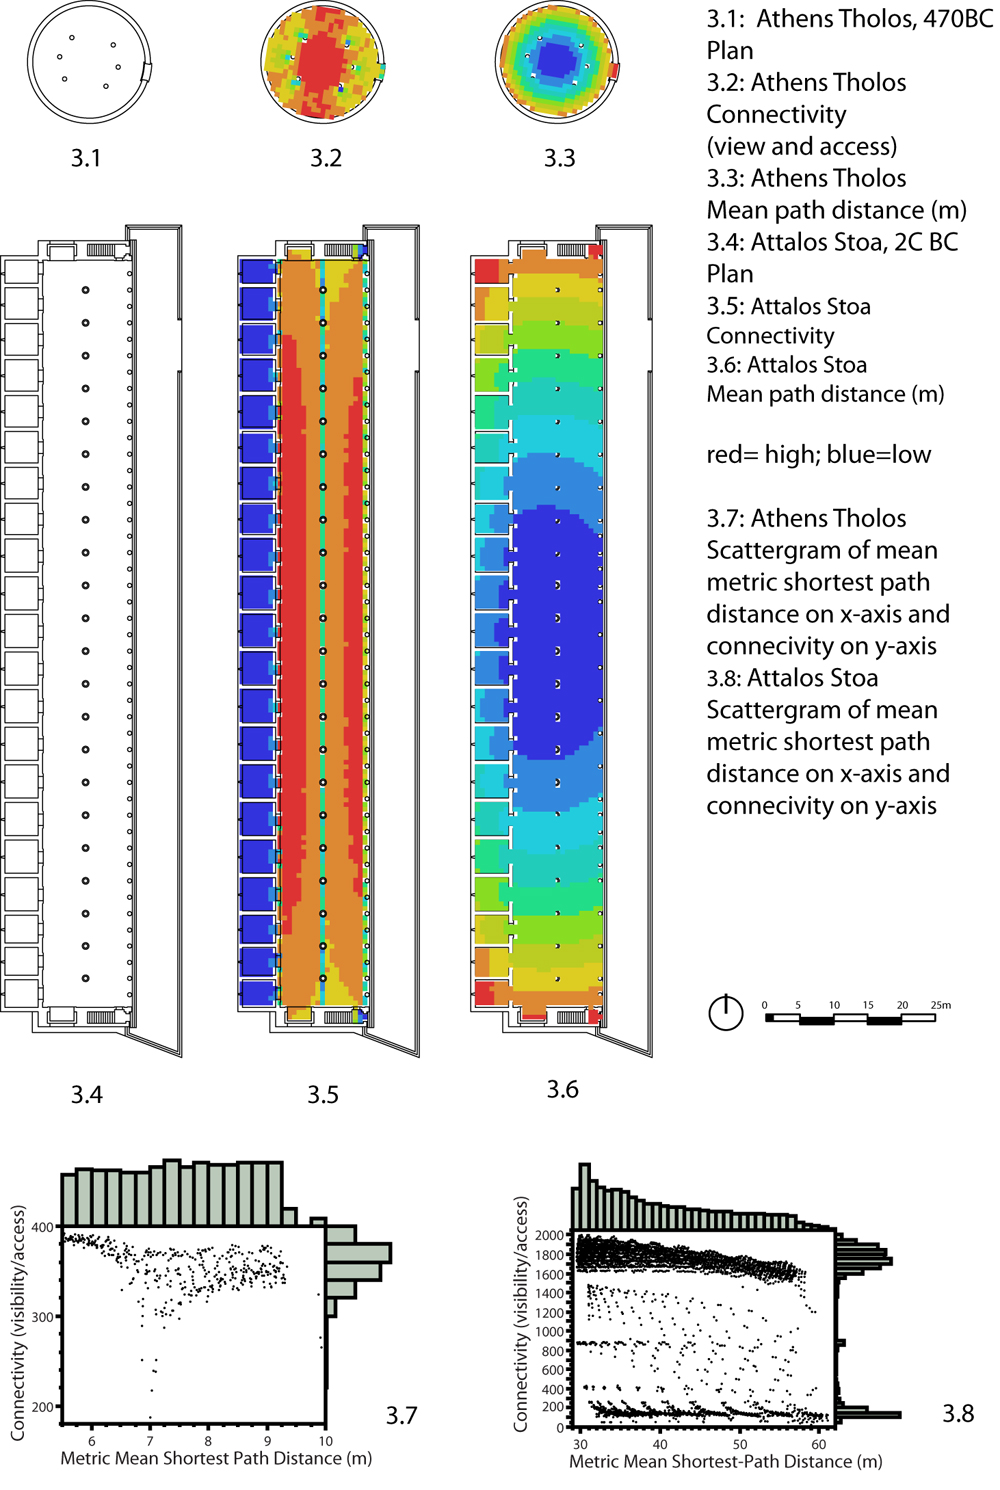
Figure 3: An analysis of the Tholos of Athens and the Attalos Stoa: elasticity of purview relative to metric distance
The global measure of purview is graphically introduced next, taking the plans of two hospitals as examples, one early and one more recent, Trinita Pellegrini in Rome and St. Thomas’ North wing in London. In both cases the underlying circulation system is a grid of intersecting axes. These cut through spaces with other primary uses in the Trinita Pellegrini; they take the form of conventional corridors in St. Thomas’. The simplest global measure of purview provided by DepthMap is called visual mean depth. The word depth survives from an earlier history of space syntax when it was originally intended to describe connectivity-graph analysis in terms of topological transitions between nodes representing spaces of variable dimensions and shapes (Hillier and Hanson 1984)3. It is more important to note that DepthMap treats the other tiles directly connected to each tile as having a depth of 1. Thus, the interpretation of DepthMap visual mean depth as mean number of turns, which I propose here, must take into account that the turns are equal to depth -1.
The plans analyzed in Figure 4 illustrate the variable relationship between the local and global measures of purview. In the case of Trinita Pellegrini, the presence of large rooms or courtyards draws connectivity into two clearly visible poles. By contrast, in St. Thomas’, high connectivity is drawn to the intersections between corridors. In both cases, the areas in which minimum turns are lowest encompass the connecting circulation network. However, in St. Thomas’ they appear to subsume the areas of high connectivity, while in Trinita Pellegrini they bridge between them. In short, the interplay between the local and the global measure of purview is variable. The perusal of the graphic representation of purview leads us to see the interplay of different sub-shapes. Whether and how these become elements of cognitive maps is an open question discussed below.
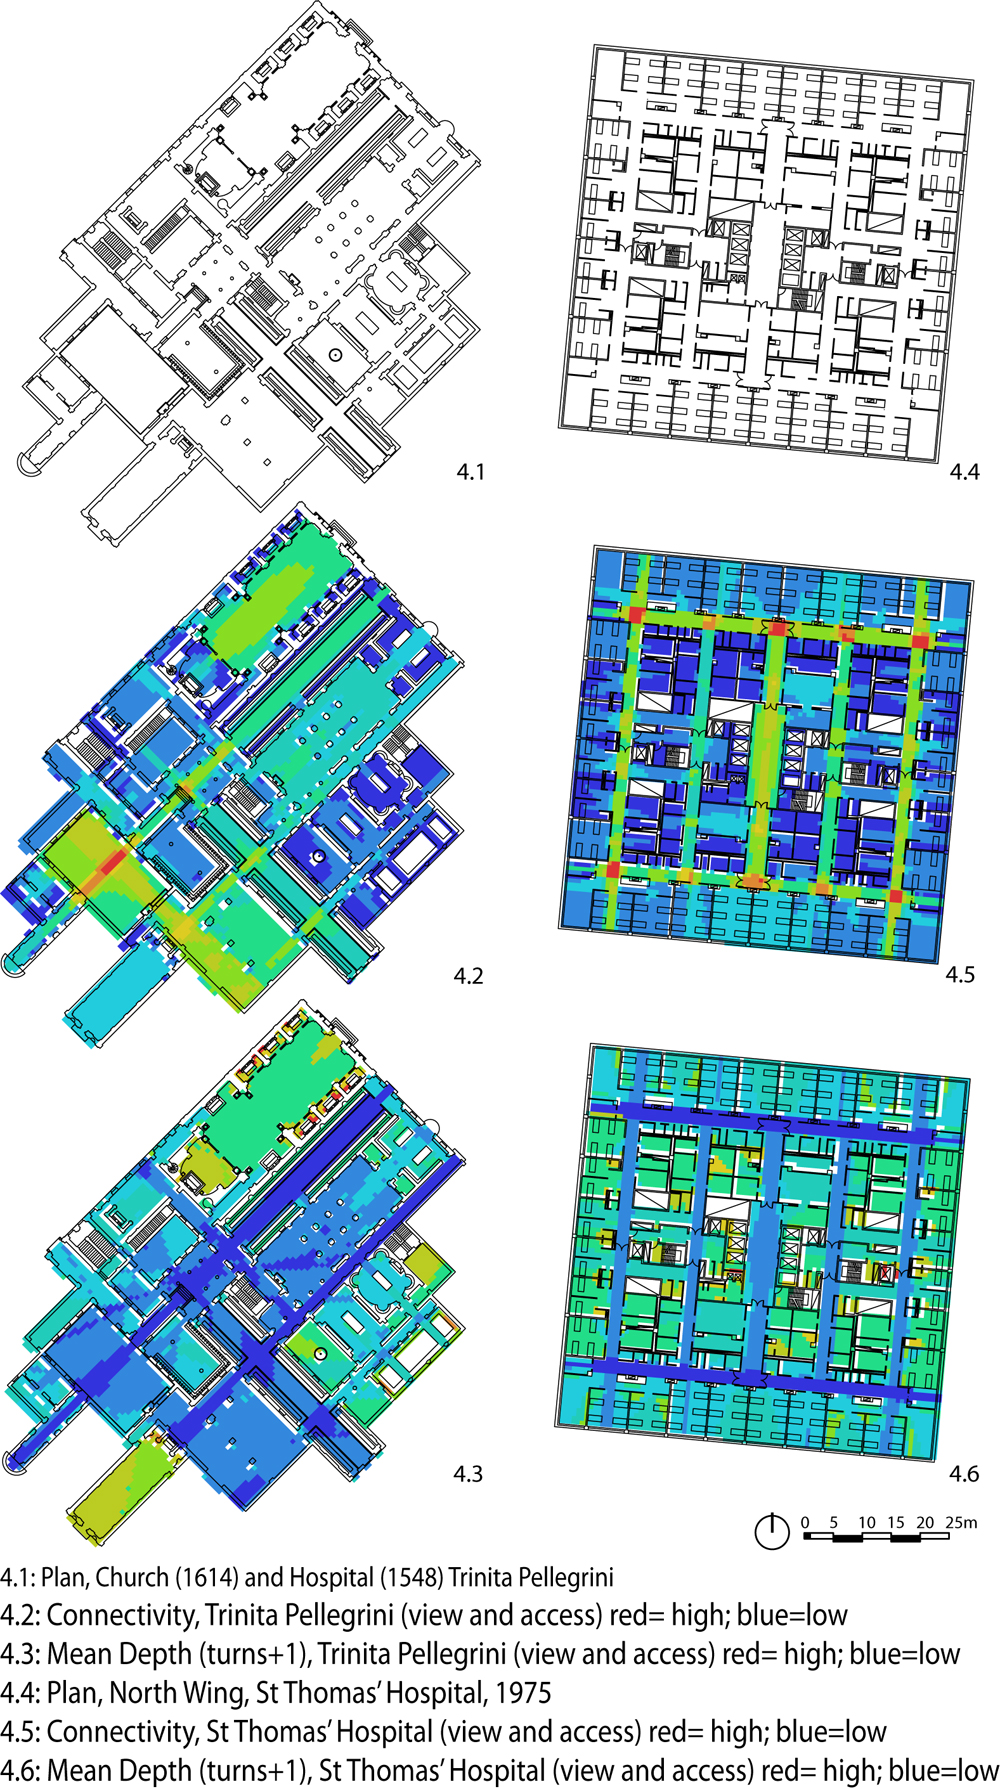
Figure 4: An analysis of Church and Hospital Trinita Pellegrini (Rome) and St.Thomas’ Hospital (London): purview and mean turns
The sample of 67 buildings comprises 425726 tiles, equivalent to an area of 208605.74m2. Table 2 offers a profile of the whole sample based on tile-based measures. The second column of the table provides a measure of direct purview, the area visible from a tile, in square meters. This is computed by multiplying DepthMap connectivity by the area of each tile and adding the area of the root-tile itself, as follows: direct purview = (DepthMap connectivity + 1)*0.49m2. The third column of the table expresses direct purview as a proportion of the total available area of the corresponding floor layout. The sample mean relative purview is 0.095. Thus, less than 10% of the available area is visible from the average individual tile even though the maximum relative purview (in the Vafeio Tomb of the Mycenaean period) is about 0.95. As shown in the fourth column, other tiles are at an average distance of about 62m. The fifth column shows the average number of turns needed to reach other tiles. This is computed as follows: mean number of turns = (DepthMap visual mean depth - 1). As shown, the average tile is 2.5 turns away. The turns are caused by intervening boundaries; these also cause a path elongation of about 22% of the straight line distance on average, as shown in the sixth column. Path elongation is computed as follows: path elongation = (DepthMap metric mean shortest path distance - DepthMap metric mean straight line distance)/(DepthMap metric mean straight line distance). The seventh column describes path length per turn, computed by dividing mean metric path distance by the mean number of turns for each tile. The sample mean is approximately 29 meters.
The distribution of the mean number of turns needed to reach other tiles in a layout merits some further attention. The maximum mean number of turns for the sample is quite large and equal to 10.7. This, however, occurs in a hospital complex of 17788 m2 in area. For 75% of the tiles the mean number of turns required to reach other tiles is less than 3.27 while for 90% it is less than 4.5. Thus, for the vast majority of positions analyzed, the average number of turns required to reach other positions is not very high. Buildings are, from this point of view, rather simple arrangements of space, where simplicity, in this case, means that available spaces are relatively few turns away.
Pair-wise correlations between logarithmic transformations of relative direct purview, mean turns, and path elongation are computed. The transformations are implemented to normalize the distributions as much as possible and to render the correlations as linear as possible. Higher direct relative purview is associated with lower mean turns (n = 425726, r2 = 0.698, beta coefficient = -0.699, p<0.0001) and lower path elongation (n = 425726, r2 = 0.291, beta coefficient = -0.351, p<0.0001); higher number of mean turns is associated with higher route elongation (n = 425726, r2 = 0.445, beta coefficient = 1.076, p<0.0001). These correlations are intuitive. From an experiential point of view, however, route elongation is of lesser interest as a measure of layout complexity because it is based on data not available to perception at one point in time or over any time interval. We cannot easily estimate the straight line distance between two locations when we are situated within a domain partitioned by physical boundaries. Relative direct purview also cannot be measured based on directly available sense data. It is not easy to estimate the total available area of a subdivided building. It is possible, however, based on a measure such as direct purview. While the mean number of turns can in principle be computed based on sense data, it is actually a convenient abstraction. We hardly ever move from one location to all others, except perhaps in a house or other relatively small building. However, it captures our sense of whether a location is directly accessible or not. This sense is normally built over time and based on the experience of different paths.
When a linear regression model is run with log mean turns as the dependent variable and both path elongation and log relative direct purview as independent variables, r2 is 0.76 and both effects are significant (p<0.0001). The effect of the log direct purview variable (standardized beta coefficient = -0.672) is stronger than the effect of log path elongation (standardized beta coefficient = 0.305) and the variance inflation factor (VIF) is relatively low (1.41). Thus, the mean number of turns objectively expresses the effects of both the amount and distribution of direct purview, and of path elongation arising from the presence of boundaries relative to the accessibility of positions in a building.
Size, complexity and simplification
This section considers the effect of layout size measured in square meters. As buildings become larger, the logarithm of path distances grow with the square root of area (n = 67, r2 = 0.787, beta coefficient = 0.853, p<0.0001). Of course, the strength of the correlation should not obscure important differences based on geometry and design. The church of Hagia Sophia, a relatively compact open plan of about 5730m2, is associated with 42.26m of mean distance (and path elongation of about 1%). The Nelson Atkins museum with an elongated subdivided plan of 5800m2 is associated with 95m mean distance (and path elongation of about 6%), more than twice the mean distance of Hagia Sophia.
Intuition suggests that growth also brings complexity. One indicator of this is the increase of the logarithm of mean turns with the square root of area (n = 67, r2 = 0.288, beta coefficient = 0.0134, p<0.0001). Thus, the amount of variance in turns which is accounted for by area is much less than the amount of variance in distance. In other words, the number of mean turns mediating the relationships between two random positions in a building is greatly affected by other factors, most importantly by the design, in addition to the floor area. The church of Hagia Sophia has 0.668 mean turns; the Nelson Atkins museum has 2.841, more than four times the mean turns of Hagia Sophia.
Given the logarithmic relationship, an increase of half a turn in the building-mean of tile-mean turns is associated with variable increments of the area. Thus, taking into account the beta regression coefficient, the eight half-turn increments from 0.5 to 1, 1.5… 4 turns are associated with approximately 50.31, 29.43, 20.88… 7.65m increments of the side of a square with the same area as the buildings under consideration. Or, stated differently, doubling the mean number of turns requires an increase of the side of a square with the same area as the floor under consideration by approximately 50 meters. The larger the building-mean of tile-mean turns one starts with, the lesser the area increment needed to bring about an increase of 0.5 turns. This amplifies the importance of design strategy; for example, aligning or offsetting corridors will greatly affect the experience of larger floor plans.
Given the tendency of buildings to become more complex as they grow larger, the question arises as to whether there are counterbalancing simplificatory factors. One means of potential simplification is the increase of the logarithm of mean direct purview with the square root of area (n = 67, r2 = 0.266, beta coefficient = 0.02, p<0.0001). In itself, this implies less tight subdivision of space in larger buildings. More importantly, the logarithm of maximum direct purview also increases with the square root of area (n = 67, r2 = 0.54, beta coefficient = 0.028, p<0.0001). Thus, larger buildings afford more powerful overviews from their best vantage point. To be sure, the logarithm of relative direct purview falls with the square root of area (n = 67, r2 = 0.332, beta coefficient = - 0.024, p<0.0001). The same is true for the logarithm of max relative direct purview (n = 67, r2 = 0.314, beta coefficient = - 0.016, p<0.0001). However, consideration of the beta regression coefficients involved suggests the following: direct purview doubles with approximately 34m increments of the square root of area; maximum purview doubles with approximately 24m increments; relative direct purview halves with 29m increments; maximum relative direct purview halves with 44m increments. In short, the rate of increase of the absolute values of direct purview is slower than the rate of decrease of relative purview. At the same time, the rate of increase of maximum purview is faster than the rate of decrease of maximum relative purview. This indicates that the creation of increasingly powerful best vantage points is a counterbalancing factor as buildings grow larger. The issue will be taken up again in the next section, as the internal structure of layouts is considered in greater detail.
Another simplificatory factor is revealed by considering the composite measure distance per turn. The measure of distance per turn for an individual tile is obtained by dividing the mean distance by the mean turns to all other tiles. In a given building with normal amounts of subdivision, the highest values are at the ends of long corridors or straight paths cutting through boundaries. Due to the elasticity of purview relative to distance, discussed earlier, such locations have similar mean depths to the mid points of corridors or straight paths but entail longer walking distances. When the measure is averaged for a building floor it serves as a good index of the amount of straight walking between turns on the shortest path between any two locations. Note, however, that for plans with little or no internal subdivision the value becomes extremely high and can exceed the actual value of mean distance. Thus, the value must be treated as a theoretical index only. In a perfectly open convex building layout, it would be infinite.
The logarithm of distance per turn becomes larger as the square root of area increases (n = 67, r2 = 0.17, beta coefficient = 0.004, p = 0.0005). The beta regression coefficient suggests that an increase of the distance per turn by 20% would increase the side of a square with the same area as the building floor under consideration by approximately 60 meters. While the rate of impact is not very strong, the association between size and distance per turn is a rather fundamental finding. Therefore, as building layouts become larger they acquire greater linear extensions of direct purview, producing greater distances per turn and, by implication, limiting the increase in mean turns that would otherwise be possible.
In conclusion, as buildings get larger they also get more complex, as indicated by the increasing numbers of turns between any two locations. The increase in complexity, however, is kept in check by at least two simplificatory mechanisms. The first mechanism of simplification, namely the increase in the maximum direct purview, implies a principle of focality, the emergence of ever more powerful vantage points. A visual inspection of the plans indicates that focality is often distributed over multiple non-adjacent vantage points, as shown in Figures 4.2 and 4.5. The second mechanism of simplification, namely the increase in distance per turn, implies a principle of linearity, the creation of linearly extended direct purviews. A very elementary visual example of this is offered in Figure 3.5. Given the elasticity of purview relative to distance, this contributes to keeping the increase in turns in check.
The purview interface as a mechanism of simplification: the synchronization of relationships
This section looks more carefully at the internal structure of building layouts. For the set of tiles as a whole (n = 425726) the distributions of relative direct purview and mean turns are both positively skewed. Thus, there are few tiles with very high values of relative direct purview, and also few tiles with a high number of mean turns. Suppose that high values of relative direct purview and low values of mean turns are conducive to easier orientation (seeing more and being few turns away from what is not directly visible is better than seeing less and being many turns away from what is not directly visible). The skewness of the distributions indicates an asymmetry of the two different kinds of advantage. Many locations are characterized by low values of mean turns, while few locations are characterized by high values of direct purview. To explore this further, k-means cluster analysis was performed on all buildings for 2, 3, 4, and 5 clusters, first based on direct relative purview and then based on mean turns. For the sample of 67 buildings, the mean membership of the clusters with highest and lowest relative direct purview and the mean membership of the clusters with the lowest and highest mean turns, expressed as proportions of the total number of tiles in each building, are shown in Table 3, along with the corresponding mean values of these clusters. The data confirm, for the sample of 67 buildings as a whole, the relative abundance of tiles with low mean turn values as compared to tiles with high direct relative purview values. Thus, buildings have a larger number of positions from which all other positions are a small number of turns away, and a smaller number of positions offering a more generous direct purview of their interior.
It makes sense, therefore, to study more closely the distribution of the positions with the strongest direct purview in each building. Using DepthMap, one way to do this is to ask how far, in number of turns or in metric distance, the average tile is from the 10% of tiles which offer the most extensive direct purview. For the sake of convenience, the tiles which belong to the top 10 percentile with respect to direct purview will be called overview tiles. As shown in Table 4.1, 90% of all tiles analyzed are up to 2 turns away from the nearest overview tile and 50% of them are directly accessible from an overview tile. Furthermore, the metric distance of 90% of all the tiles from the nearest overview tile is no more than 60% of the mean distance of those tiles from all available positions. For 50% of all tiles the distance from the nearest overview tile is no more than 20% of their mean distance from all available positions. Thus, overview tiles are strategically distributed so that they can function as useful anchor references for the development of cognitive representations. Table 4.2 shows a similar result by looking at the means per building. On average, for the 67 buildings, the building-mean of the tile-mean number of turns to the nearest overview tile is less than half the building-mean of the tile-mean number of turns. The building-mean of the tile-mean distance to the nearest overview tile is less than one third of the building-mean of the tile-mean distance.
The idea of interface, previously introduced by way of example (Figure 3), now acquires quantitative expression. One mechanism by which a building’s layout becomes simpler to understand is the relative proximity of tiles of limited direct purview to tiles of more expansive direct purview, or overview. This proximity is made possible by the strategic distribution of overview tiles. I call the particular interface in question the purview interface. The foregoing discussion of the purview interface helps to clarify a significant property of locations with high purview values in buildings. High purview is not merely a matter of seeing more area, benefiting from a larger visual field. Rather it is a matter of seeing more relationships or connections all at once. The larger visible area that defines high purview functions strategically precisely because it brings with it the synchronization of many relationships.
What is the impact of the strategic distribution of high purview? To be sure, in less subdivided buildings the likelihood that turns will be necessary to move between any two locations is reduced. This is expressed as a powerful log-log correlation between the mean relative direct purview of a building and the building mean of the mean turns per tile (n = 67, r2 = 0.817, beta coefficient = 0.567, p<0.0001). However, the square root of the mean number of turns to the nearest overview tile is also strongly correlated with the logarithm of the building mean of mean turns (n = 67, r2 = 0.552, beta coefficient = 1.841, p<0.0001). The fewer the number of mean turns from the nearest overview tile the fewer the overall mean turns. More importantly, when a regression model is run with the log of the mean turns as the independent variable and the log of mean relative purview, the square root of mean turns from the nearest tiles and the square root of building area as independent variables, the following conclusions are reached: first, building area no longer has any statistically significant effect; second, the log of mean relative direct purview and the square root of mean turns from the nearest overview tile produce an r2 of 0.926, p<0.0001, with a variance inflation factor (VIF) of 1.347. Thus, the evidence suggests that the strategic distribution of high purview locations is the main structural mechanism that helps keep the number of mean turns in check.
The idea of purview interface is open to further development, most notably in the direction of developing typologies of layouts. When based on an understanding of principles, typologies serve to organize the structure of the design solution field (Hillier and Leaman 1974; Peponis 2005) and to facilitate the evaluation of a particular design relative to other designs of a similar kind. Purview interfaces can be differentiated in two ways. First, by asking how much stronger the direct purview of overview tiles (10% highest direct purview values) is compared to other tiles. I call the ratio of the two direct purview values the differentiation ratio. The higher the differentiation ratio, the more overview tiles differ from other tiles. Second, by asking how many turns away other tiles are from the nearest overview tile compared to the mean turns from all tiles. I will call this the distribution ratio. The higher the distribution ratio, the greater the difference between proximity to the nearest overview tile and distance from the average tile, measured in direction turns. The heuristic typology that arises when using these two ratios is illustrated in Figure 5. The interface is strongly differentiated and distributed in St. Thomas’ Hospital, strongly differentiated but weakly distributed in the main floor of Scottish Parliament, weakly differentiated and strongly distributed in the ground floor of Exeter Library, and weakly differentiated and distributed in the ground floor of Palazzo Farnese.
Differences in purview interface may well reflect programmatic differences regarding the social function of buildings. Thus, in the Scottish Parliament and the Palazzo Farnese the presence of powerful overview spaces (lobbies and courtyard, respectively) is counterbalanced by the presence of indirectly accessible spaces, the spaces more likely to accommodate functions that are more exclusive and require greater confidentiality or withdrawal from exposed views. Thus, the interface is more weakly distributed. In St. Thomas’ Hospital and Exeter Library, the interface is strongly distributed, reflecting the design intention to integrate everything into a coherent functioning system. In the hospital, strong distribution is coupled to strong differentiation, and there is a clear programmatic difference between circulation spaces, attached nurses’ stations, and patient rooms. In the ground floor of the Exeter Library, differentiation on plan is weak, and the central space is continuous to the peripheral bookstacks areas. The intent is to make the latter appear extensions of the former. That building design can be treated as an act of balancing particular programmatic requirements and design intentions against the more generic requirements of intelligibility is a hypothesis that makes intuitive sense. Properly pursuing its development is beyond the scope of this paper.
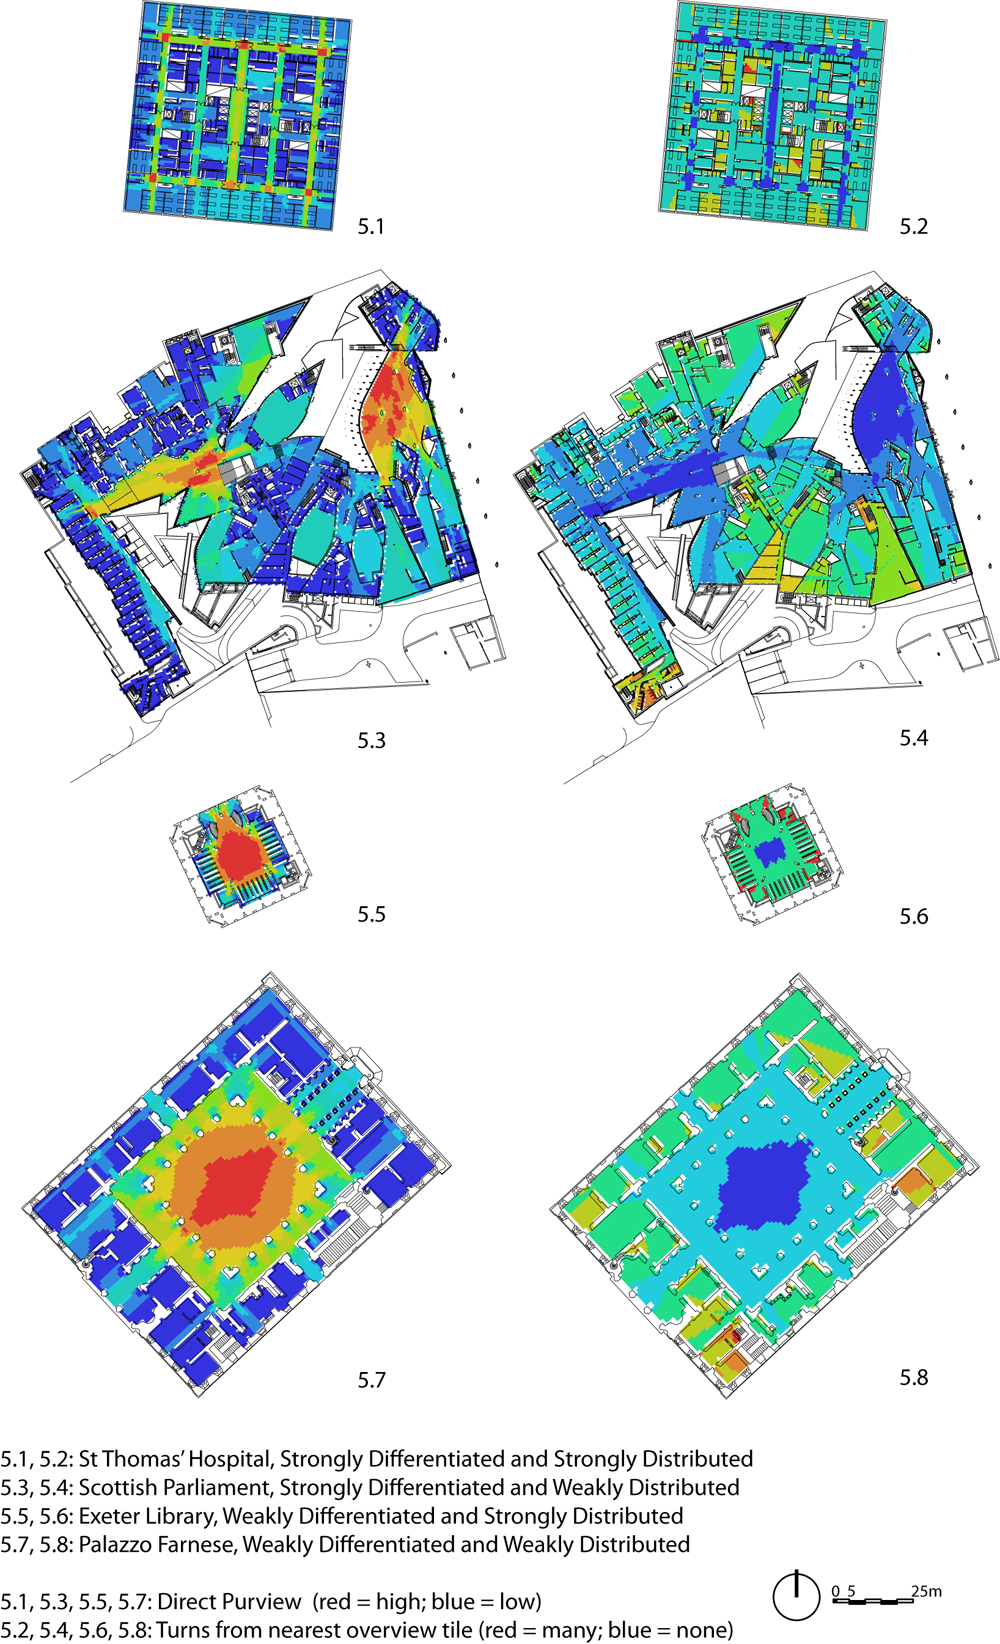
Figure 5: A heuristic typology of purview interfaces
Discussion
In this paper I have tested how far we can use the analysis of very rudimentary relationships with clear experiential associations (the relationship of direct connection or disconnection between any two tiles) to build descriptions of more complex properties of buildings. Based on the analysis I have proposed, the idea of the purview interface is an elementary structural feature that contributes to the intelligibility of building layouts. The strategic distribution of overview spaces within a layout ensures that most other available locations are less than two turns away from the nearest overview tile, and that the mean distance of all available locations in a building from an overview tile is very low and less than one turn. I have also shown that the number of turns separating any two locations in a building does not increase with area as fast as metric distance. For most of the buildings in the sample, the mean number of turns is below five. This is a by-product of the purview interface. Thus, even as buildings grow large, the affordance of indirect purview stays within well-defined bounds.
To what kinds of cognitive models might the foregoing analysis contribute? Suppose we follow O’Keefe and Nadel (1978, p. 86) in defining a map as a representation of a set of connected places which are systematically related to each other by a group of spatial transformation rules. Suppose also that we adopt Tolman’s (1948) cognitive map metaphor for describing the representation of a building in the head. The familiar questions that arise include the following: whether the map features all available places, for example the equivalent of all tiles represented in DepthMap; whether it features all available relationships of a kind, for example, the equivalent of all binary relations of direct access and view analyzed in DepthMap; whether it features multiple kinds of relationships; whether there is a hierarchy in the representation of featured places and relationships. The analysis presented here is congruent with the idea of a hierarchy to the cognitive mapping of layouts. More particularly, it is intrinsically compatible with the idea that cognitive representations of layouts might have a skeleton of primary connected spaces such that other spaces can initially be located with reference to the skeleton (Kuipers et al. 2003). From this point of view, however, the analysis needs to be extended in important ways.
A subject moving in a building and intuitively comparing locations for the direct purview they afford might be able to remember the particular locations that offer greater overview and link other locations to them. Remembering would naturally be assisted by the intrinsic elasticity of purview. By definition, locations affording greater overview cluster to form larger internally connected areas, and these areas are likely to feature longer in the field of vision of a moving subject. The analysis offered above does not computationally engage this critical step – the synthesis of many linked overview tiles into recognizable larger scale units. One future task is to compute the largest possible subsets of tiles with high purview for which all possible direct links hold (a requirement of convexity and continuity). This would be the computational equivalent of being able to recognize the sub-shapes defined by patches of red or orange color in Figures 4.2 and 4.5.
Even this step, however, would not suffice. The next task would be to ask what connections join all areas of overview into a continuous system. This would be equivalent to computationally recognizing something akin to the sub-shapes defined by patches of blue color in Figures 4.3 and 4.6. Those patches represent areas of low mean depth, or, given the transformation implemented, low mean turns. As noted earlier, from an experiential point of view mean turns are actually a convenient abstraction: we hardly ever move from each location to all others in a building. The task ahead, therefore, is to develop criteria with plausible experiential correlates in order to identify a continuous sub-shape that comprises overview areas and can act as a skeleton for a cognitive map. One possibility is to find the least turn paths that join overview areas. A subsequent theory of intelligible layouts would then address the following questions. What are the exact criteria for deciding whether the skeleton sub-shape is well distributed so that no part of the layout has too complicated a relationship to the skeleton? What are the criteria for deciding whether the skeleton sub-shape is itself easy to map and to remember?
The analysis of data from a large number of buildings is a rich and relatively unexplored source of potential insights regarding spatial cognition. If we can learn about cognition by studying the human artifacts that provide a framework for cognitive functions, then cognitive science will benefit from better organized exchanges with architectural research.
Acknowledgment
Chen Feng, Alice Vialard and Sophocles Giannakopoulos, have significantly contributed to the drawings data base which made this paper possible. Alexandra Barletta, Ho Hyun Eum, Altug Kasali, Khatereh Hadi, Michael Howard, Yunxin Hu, Ralph Iberle, Seon Yeong Ji, Keith Jundanian, Scharl Young Koh, Lorissa MacAllister, Michelle Ossmann, Adetania Pramanik, Soojung Shin, Benjamin Smith, Zachary Stanton, Matthew Swarts, Taylor Walters and Katarzyna Zycinska have also contributed to the task. I also thank everyone for discussions that have paved the way to this paper. The School of Architecture, Georgia Institute of Technology, has supported this work by funding a doctoral graduate research assistant.
endnotes
- Parametric analysis in space syntax began by looking at literal transitions across boundaries with the understanding that every boundary corresponds to some sort of categorical distinction or social sanction. It evolved to address other kinds of transitions, for example transitions from one convex space to another directly connected to it, or from one line of movement to another intersecting it. The particular transitions of interest to me are transitions in visual horizon. Unless one crosses a door threshold and shuts the door behind, these are by definition partial transitions. In space syntax, transitions of this sort are implicit when space is discretized into networks of intersecting lines of movement or networks of connected convex spaces. No matter how the relevant transitions or underlying discretization of space are handled, however, the fundamental premise in space syntax is that each space has to be considered in its relationships to all the other spaces of the system and not just in its relationship to the spaces with which it is in direct contact, hence the prominence, in space syntax, of graph theoretic measures to describe the properties of different kinds of networks.
- That DepthMap does not automatically compute area has a historical explanation which is not relevant to the argument developed here. In early space syntax, graph theoretic measures, including node-connectivity, were applied to representations of layouts inherently not sensitive to metric properties. The hypothesis pursued was that the social logic of buildings is more clearly expressed in topological relationships. In this paper, I treat metric properties as fundamental to the analysis.
- In order to allow for comparisons between graphs with different numbers of nodes, space syntax proposes a normalized measure of mean depth assuming values between 0 and 1 (originally called relative asymmetry for reasons too obtuse to review here), and then a relativized measure intended to take values around 1 (originally called real relative asymmetry, with its reciprocal called integration). The relativized measure compares normalized mean depth for a given graph to the normalized mean depth of a standard graph chosen for benchmarking. The original intent was to recognize that normalized mean depth tends to fall for graphs representing buildings with more spaces. The subsequent advantage of the relativized measure was that it enables an analysis of each space of a layout relative to the variable number of spaces that are accessible up to a specified number of transitions away from it. It is simpler to measure the area which is accessible up to a certain number of transitions, in order to avoid premature assumptions regarding the discretization of such area into spaces. Also, it is better to use measures that have clear units attached to them, and clear intuitive meaning. Thus, I will not adopt or presuppose any kind of relativization in the development of my argument.
References
Benedikt ML (1979) To take hold of space: isovists and isovist fields. Environment and Planning B 6:47-65
Choi YK (1999) The morphology of exploration and encounter in museum layouts. Environment and Planning B: Planning and Design 26:241-250
Haq S (2003) Investigating the syntax line: configurational properties and cognitive correlates. Environment and Planning B: Planning and Design 30:841-863
Haq S, Zimring C (2003) Just down the road a piece. The development of topological knowledge in building layouts. Environment and Behav 35:132-160
Hillier B (1996) Space is the machine. Cambridge University Press, Cambridge, UK
Hillier B, Hanson J (1984) The social logic of space. Cambridge University Press, Cambridge, UK
Hillier B, Leaman A (1974) How is design possible? J Architectural Res 1:4-11
Kuipers B, Tecuci DG, Stankiewicz BJ (2003) The skeleton in the cognitive map. A computational and empirical exploration. Environment and Behav 35:81-106
Lu Y, Zimring C (2011) Can intensive care staff see their patients? An improved visibility analysis methodology. Environment and Behav, published online: http://eab.sagepub.com/content/early/2011/04/15/001.391.6511405314.abstract
Moeser SD (1988) Cognitive mapping in a complex building. Environment and Behav 20:21-49
O’Keefe J, Nadel L (1978) The hippocampus as a cognitive map. Clarendon Press, Oxford, UK
Peponis J, Zimring C, Choi YK (1990) Finding the building in wayfinding. Environment and Behav 22:555-590
Peponis J, Conroy-Dalton R, Wineman J, Dalton N (2004) Measuring the effects of layout upon visitors’ spatial behaviors in open plan exhibition settings. Environment and Planning B: Planning and Design 31:253-273
Peponis J (2005) Formulation. J Architecture 10:119-133
Peponis J, Wineman J (2002) The spatial structure of environment and behavior. In: Bechtel R, Churchman A (eds) Handbook of environmental psychology. John Wiley and Sons, New York, NY, pp 271-291
Rosano N, Reardon W (1999) Goal specificity and the acquisition of survey knowledge. Environment and Behav 31:395-412
Sliwa J, Fairweather L (eds) (1970) Architects’ journal metric handbook. The Architectural Press, London, UK
Tolman EC (1948) Cognitive maps in rats and men. Psychol Rev 55:189-208
Turner A, Doxa M, O’Sullivan D, Penn A (2001) From isovists to visibility graphs: a methodology for the analysis of architectural space. Environment and Planning B: Planning and Design 28:103-121
Turner A, Penn A, Hillier B (2005) An algorithmic definition of the axial map. Environment and Planning B: Planning and Design 32:425-444
Werner S, Schindler L (2004) The role of spatial reference frames in architecture. Misalignment impairs way-finding performance. Environment and Behav 36:461-482
Table 1: Sample of 67 Buildings
| BUILDING | LOCATION | ARCHITECT | DATE | SOURCE |
| Altes Museum | Berlin, Germany | Karl Friedrich Schinkel | 1823 | Schinkel K F (1983) Collected Architectural Designs (London: Academy Editions, St Martin’s Press) |
| Altes Pinakothek | Munich, Germany | Leo von Klenze | 1826 | Markus, T (1993) Buildings and Power (London: Routledge) |
| Atheneum | New Harmony, IN, USA | Richard Meier | 1975 | Meier R (1981) Richard Meier Architect, 1964-1984 (New York: Rizzoli) |
| Attalos Stoa | Athens, Greece | Unknown | 159-138BC | Travlos J (1971) Pictorial Dictionary of Ancient Athens (London: Thames and Hudson) |
| Baden Vocational | Baden, Germany | Burkard Meyer | 2006 | Deplazes A (ed) (2009) Constructing Architecture: Materials Processes Structures: A Handbook (Basel: Birkhäuser) |
| School | ||||
| Baker House | Cambridge, MA, USA | Alvar Aalto | 1948 | Aalto A, Baird G (1971) Alvar Aalto (New York: Simon and Schuster); Aalto A, Reed P (1998) Alvar Aalto: between humanism and materialism (New York: Museum of Modern Art) |
| Barcelona Pavilion | Barcelona, Spain | Mies van der Rohe | 1929 | Sola-Morales I, Cirici C, Ramos F (1993) Mies van der Rohe Barcelona Pavilion (Barcelona: Gustavo Gili); Weston R (2010) Key Buildings of the 20th Century (New York: W W Norton & Company) |
| Barranca Museum | Guadalajara, | Jacques Herzog and Pierre de Meuron | Unbuilt, current | El Croquis (2010) 152-153 |
| Mexico | ||||
| Bazaar Kashan | Kashan, Iran | Unknown | 1800 | Ardalan N, Bakhtiar L, and Haider S G (1973) The sense of unity: the Sufi tradition in Persian architecture (Chicago: University of Chicago Press) |
| Bellevue Hospital | New York, NY, USA | Skidmore Owings Merrill | 1949 | Progressive Architecture (1949) 30: 57-69 |
| Berlin Philharmonie | Berlin, Germany | Hans Scharoun | 1963 | Blundell-Jones P (1978) Hans Scharoun, a Monograph (London: Gordon Fraser); Blundell-Jones P (1995) Hans Scharoun (London: Phaidon Press); Weston R (2010) Key Buildings of the 20th Century (New York: W W Norton & Company) |
| Biel Engineering School | Biel, Switzerland | Marcel Meili and Markus Peter | 1999 | Deplazes A (ed), 2009, Constructing Architecture: Materials Processes Structures: A Handbook (Basel: Birkhäuser) |
| Caravanserai Chaleh Siah | Chaleh Siah, Iran | Taher Isfahani | 1686 | Hillenbrand R (1994) Islamic architecture: Form, function, and meaning (New York: Columbia University Press) |
| Centraal Beheer | Apeldoorn, Netherlands | Herman Hertzberger | 1975 | Architects' Journal (1975) 162 (44): 893-904; Herman Hertzberger (1987) Buildings and Projects 1959-1986 (Den Haag: Arnulf Lüchiger, Arch-Edition) |
| Chandigarh Administration Building | Chandigarh, India | Le Corbusier | 1952 | Le Corbusier (1957) Oeuvre Complete 1952-1957, (Zurich: Les Editions d’ Architecture) |
| Delos Hill House | Delos, Greece | Unknown | 300-100BC | Fletcher B (1987) (Musgrove J ed) A History of Architecture by the Comparative Method. (London: Butterworths) |
| Dublin Methodist Hospital OH | Dublin, OH, USA | Karlsberger | 2007 | Original Drawing |
| Evelyn Grace Academy | London, UK | Zaha Hadid | 2011 | Architectural Record (2012) 200(1): 100-105 |
| Exeter Library | Exeter, NH, USA | Louis Kahn | 1971 | Ronner H, Jhaveri S (1987) Louis Kahn Complete Work 1935-1974 (Basel: Birkhäuser) |
| Fallingwater | Mill Run, PA, USA | Frank Lloyd Wright | 1935 | Kaufmann E (1986) Fallingwater: A Frank Lloyd Wright Country House (Abbeville Press, NewYork); Weston R (2010) Key Buildings of the 20th Century (New York: W W Norton & Company) |
| Farnese Palace | Rome, Italy | Antonio da Sangallo | 1546 | Latarouily P (1928) Edifices de Rome Moderne (London: John Tiranti & Co) |
| Fratte Monastery | Rome, Italy | Giovanni Guerra; Francesco Borromini | 1653 | Latarouily P (1928) Edifices de Rome Moderne (London: John Tiranti & Co) |
| Ghana1 Nangodi compound, | Nangodi, Ghana | Vernacular | 1971 | Archer I (1971) “Nabdam Compounds, Northern Ghana”, in Oliver P (ed) Shelter in Africa (New York: Praeger Publishers): 46-57 |
| Hagia Sophia | Istanbul, Turkey | Isidore of Miletus and Anthemius of Tralles | 537 | Αντωνιάδης E M(1909) ´Εκφρασις της Αγíας Σοφíας (Athens, GR: Εκδóσεις B. Γρηγοριάδης & Υιοí) |
| Helsingor Clinic | Helsingor, Denmark | Bjarke Ingels Group | 2005 | BIG (2010) Yes is More (Köln: Taschen); |
| http://www.architecturenewsplus.com/projects/1415; http://archinect.com/firms/project/39903/helsing-r-psychiatric-hospital/9179412 | ||||
| Heraion1 Samos | Samos, Greece | Unknown | 775BC | Κωνσταντινíδης Δ Η (1973) Μαθήματα Ιστορíας της Αρχιτεκτονικής, Ιστορική Ελλάς, Αρχαíα Εποχή (Athens, GR: National Technical University of Athens) |
| Heraion2 Samos | Samos, Greece | Unknown | 675BC | Κωνσταντινíδης Δ Η (1973) Μαθήματα Ιστορíας της Αρχιτεκτονικής, Ιστορική Ελλάς, Αρχαíα Εποχή (Athens, GR: National Technical University of Athens) |
| High Museum of Art | Atlanta, GA, USA | Richard Meier | 1983 | Meier R (1981) Richard Meier Architect, 1964-1984 (New York: Rizzoli) |
| Lambeth Community Clinic | London, UK | Ed Cullinan | 1985 | Architects’ Journal (1985) 182 (42): 60-103 |
| Larkfield Hospital, Greenock Royal Infirmary | Greenock, UK | Richard Llewelyn Davis | 1954 | Nuffield Provincial Hospitals Trust (1955) Studies in the Function and Design of Hospitals (London: Oxford University Press) |
| Lesser Propylea Eleusis | Eleusis, Greece | Unknown | 40BC | Κωνσταντινíδης Δ Η (1973) Μαθήματα Ιστορíας της Αρχιτεκτονικής, Ιστορική Ελλάς, Αρχαíα Εποχή (Athens, GR: National Technical University of Athens) |
| Leutschenbach School | Zurich, Switzerland | Christian Kerez | 2011 | Architectural Record (2012) 200 (1):110-115 |
| Maggiore (Santa Maria de Maggiore Basilica) | Rome, Italy | Domenico Fontana, Flaminio Ponzio, Carlo Rainaldi, Ferdinando Fuga | 432-440 | Latarouily P (1928) Edifices de Rome Moderne (London: John Tiranti & Co) |
| Manchester City Hall | Manchester, UK | Alfred Waterhouse | 1877 | Fletcher B (1987) (Musgrove J ed) A History of Architecture by the Comparative Method. (London: Butterworths) |
| MAXXI | Rome, Italy | Zaha Hadid | 2010 | 2010 MAXXI Zaha Hadid Architects (New York: Skira Rizzoli) |
| Musashino Library | Tokyo, Japan | Sou Fujimoto Architects | 2010 | Architectural Record (2011) 199 (3): 60-67 |
| Nasher Sculpture Gallery | Dallas, TX, USA | Renzo Piano | 2003 | Buchanan P (ed) (2008) Renzo Piano Workshop Complete Works Vol 5 (London: Phaidon) |
| National Gallery | London, UK | William Wilkins 1838; James Pennethorne, 1860; Edward Barry 1876; John Taylor, 1884; Hawkes, 1907; Richard John Allison, 1928 | 1975 | Conlin J (2006) The Nation’s Mantlepice: A history of the National Gallery (London: Pallas Athene) |
| Nelson Atkins Museum | Kansas City, MI, USA | Steven Holl | 2007 | GA Document (2007) 96: 8-31 ; Weston R (2010) Key Buildings of the 20th Century (New York: W W Norton & Company) |
| Nestor’s Palace | Pylos, Greece | Unknown | 1200-1300 BC | Blegen C W, Rawson M (1966) The Palace of Nestor at Pylos in Western Messinia (Princeton: Princeton University Press) |
| NHM | London, UK | Alfred Waterhouse | 1881 | Girouard M (1981) Alfred Waterhouse and The Natural History Museum (London: British Museum) |
| Paimio Sanatorium | Paimio, Finland | Alvar Alto | 1932 | Alvar Aalto 1922-1962, v.1 (Zurich: Les Editions d’ Architecture Artemis); Weston R (2010) Key Buildings of the 20th Century (New York: W W Norton & Company) |
| Pantheon | Rome, Italy | Appolodorus of Damascus | 126 | MacDonald W L (1976) The Pantheon: Design, Meaning, and Progeny (Cambridge MA: Harvard University Press) |
| Parthenon | Athens, Greece | Ictinus and Callicrates | 438-477BC | Ορλάνδος Α Κ (1977) Η Αρχιτεκτονική του Παρθενώνος (Athens, GR: Athens Archaeological Society) |
| Pentonville Prison | London, UK | Joshua Jebb | 1842 | Robin Evans (1982) The Fabrication of Virtue (Cambridge: Cambridge University Press); |
| Piedmont Hospital SC | Rock Hill, SC, USA | NA | NA | Original Drawing |
| SAS | Stockholm, Sweden | Niels Torp | 1988 | Architectural Review (1989) 185 (1105): 42-51 |
| Scottish Parliament | Edinburgh, UK | Enric Miralles | 2004 | El Croquis (200) 100-101; Balfour A (2005) Creating a Scottish Parliament (Edinburgh: Studio LR); Gregory R (2008) Key Contemporary Buildings (New York: W W Norton & Company); Jencks C (2005) The Scottish Parliament (London: Northburgh House) |
| Selinus G | Sicily, Italy | Unknown | 540-480BC | Κωνσταντινíδης Δ Η (1973) Μαθήματα Ιστορíας της Αρχιτεκτονικής, Ιστορική Ελλάς, Αρχαíα Εποχή (Athens, GR: National Technical University of Athens) |
| Sendai Mediatheque | Miyagi, Japan | Toyo Ito | 2001 | Japan Architect (2001) 41; Architectural Review, October 2001; Gregory R (2008) Key Contemporary Buildings (New York: W W Norton & Company) |
| SmithCarter | Winnipeg, Canada | Smith Carter | 2004 | Original drawing |
| St Joseph’s Hospital MN | St Paul’s, MN, USA | HOK and BWBR | 2009 | Original drawing |
| St Joseph's Hospital WI | West Bend, WI, USA | Gresham, Smith and Partners | 2005 | Original drawing |
| Stockholm Public Library | Stockholm, Sweden | Gunnar Asplund | 1928 | Holmdahl G, Lind S I, Ödeen K (eds) (1950) Gunnard Asplund Architect (Stockholm: AB Tidskriften Byggmästaren); Wrede S (1980) The Architecture of Eric Gunnar Asplund (Cambridge, MA: MIT Press); Weston R (2010) Key Buildings of the 20th Century (New York: W W Norton & Company) |
| St Thomas Hospital North Wing | London, UK | York, Rosenberg, Mardall | 1977 | Architects’ Journal (1977) 165 (18): 829-843 |
| Tallinn City Hall | Tallinn, Estonia | Bjarke Ingels Group | Unbuilt, current | http://www.archdaily.com/ |
| Tholos Agora Athens | Athens, Greece | Unknown | 470BC | Travlos J (1971) Pictorial Dictionary of Ancient Athens (London: Thames and Hudson) |
| ThoughtForm | Pittsburgh, PA, USA | Michael Fazio | 2002 | Peponis J, Bafna S, Bajaj R, Bromberg J, Congdon C, Rashid M, Warmels S, Zhang Y, Zimring C (2007) “Designing space to support knowledge work” Environment and Behavior 39 (6), 815-840 |
| Tiryns | Argos, Greece | Unknown | 1500-1300BC | Schlieman H (1885) Tiryns (New York: Charles Scribner’s Sons) |
| Tjibaou Cultural Center | Noumea, New Caledonia | Renzo Piano | 1998 | Buchanan P (ed) (1995) Renzo Piano Workshop Complete Works Vol 2 (London: Phaidon); Buchanan P (ed) (1995) Renzo Piano Workshop Complete Works v4 (London: Phaidon) |
| Trinita Pellegrini | Rome, Italy | Paolo Maggi | 1603 | Latarouily P (1928) Edifices de Rome Moderne (London: John Tiranti & Co) |
| Vafeio Tomb | Sparta, Greece | Unknown | 1500BC | Κωνσταντινíδης Δ Η (1970) Παραδόσεις Ιστορíας της Αρχιτεκτονικής, Μέρος Δεύτερο, Τεύχος Πρώτο: Προïστορική και Πρωτοϊστορική Ελλάς (Athens, GR: National Technical University of Athens) |
| VillaRotonda | Vicenza, Italy | Andrea Palladio | 1567 | Semenzato C (1968) The Rotonda of Andrea Palladio, v1 Corpus Palladianum (University Park, PA: The Pensylvania State University Press) |
| VillaSavoye | Paris, France | Le Corbusier | 1931 | Le Corbusier: Oeuvre Complète, v1&2. (Zürich: Editions d' Architecture) |
| Volta1 | Ghana | Vernacular | 1969 | Mumtaz B (1969) “Villages on the Black Volta” in Oliver P (ed) Shelter and Society (New York: Praeger Publishers) |
| WesleyWoods | Atlanta, GA, USA | Stevens and Wilkinson | 1988 | Peponis J, C Zimring, and Y K Choi (1990) "Finding the building in wayfinding," Environment and Behavior 22 (5): 555-590 |
| WillisFaberDumas | Ipswich, UK | Norman Foster | 1975 | Bramante G (1993) Willis Faber & Dumas Building, Architecture in Detail (London: Phaidon Press) |
| Weston R (2010) Key Buildings of the 20th Century (New York: W W Norton & Company) |
TABLE 2: Statistical profile of tile-based layout measures
Tile measures n = 425726 (equivalent to 208605.74m2) |
Direct Purview (m2) |
Relative Direct Purview (proportion of available area) |
Mean path distance (m) |
Mean Turns (Mean Depth -1) |
Path Elongation (proportion of straight line distance added) |
Path length per turn (m) |
| Sample mean | 397.52 | 0.095 | 61.743615 | 2.5149192 | 0.2187349 | 29.225794 |
| Sample maximum | 3324.16 | 0.95031 | 165.533 | 10.6767 | 2.10121 | 247.376 |
| 90% quantile | 1022.14 | 0.25248 | 100.955 | 4.49671 | 0.42633 | 49.4404 |
| 75% quantile | 485.1 | 0.11089 | 77.9518 | 3.26589 | 0.28165 | 35.1634 |
| Sample median | 189.14 | 0.04595 | 56.529 | 2.25993 | 0.18718 | 25.5601 |
| 25% quantile | 68.11 | 0.01446 | 42.2776 | 1.48855 | 0.09513 | 18.4773 |
| 10% quantile | 26.95 | 0.00493 | 31.0449 | 0.94515 | 0.04182 | 14.6496 |
| Sample minimum | 0.98 | 0.000082 | 5.49288 | 0.04984 | 0.00048 | 3.71272 |
| Sample coefficient of variation | 139.9 | 137.71 | 43.798729 | 55.319106 | 82.775564 | 50.880481 |
| Sample Skewness | 2.72 | 2.478 | 0.7006983 | 0.9749464 | 2.2616274 | 1.4913401 |
TABLE 3: k-means cluster analysis, memberships and means of highest relative direct purview an lowest mean turns clusters.
Sample of 67 buildings |
Sample-mean of highest relative direct purview cluster-mean |
Sample mean of percent of tiles in the cluster with highest relative direct purview value |
Sample-mean of lowest relative direct purview cluster-mean |
Sample mean of percent of tiles in the cluster with lowest relative direct purview value |
Sample-mean of lowest mean turns cluster-mean |
Sample mean of percent of tiles in the cluster with lowest mean turns value |
Sample-mean of highest mean turns cluster-mean |
Sample mean of percent of tiles in the cluster with highest mean turns value |
| 2 clusters | 0.232 | 0.397 | 0.081 | 0.603 | 1.702 | 0.72 | 2.87 | 0.28 |
| 3 clusters | 0.253 | 0.259 | 0.056 | 0.419 | 1.558 | 0.531 | 3.461 | 0.093 |
| 4 clusters | 0.266 | 0.186 | 0.044 | 0.332 | 1.477 | 0.425 | 3.91 | 0.03 |
| 5 clusters | 0.276 | 0.133 | 0.037 | 0.275 | 1.42 | 0.35 | 4.16 | 0.015 |
TABLE 4: Location of "overview" tiles relative to all tiles
| 4.1: Tile measures | ||||||
Tile measures (n = 425726) |
Mean Turns (Mean Depth -1) |
Turns to nearest overview tile |
Turns to nearest overview tile/mean turns |
Mean path distance (m) |
Distance to nearest overview tile (m) |
Distance to nearest overview tile/mean path distance |
| Sample mean | 2.5149192 |
0.5703 |
0.1802 |
61.743615 |
15.3489 |
0.25 |
| Sample maximum | 10.6767 |
10 |
1.5849 |
165.533 |
109.278 |
1.3346 |
| 90% quantile | 4.49671 |
2 |
0.5689 |
100.955 |
38.2447 |
0.5989 |
| 75% quantile | 3.26589 |
1 |
0.3549 |
77.9518 |
22.6038 |
0.4027 |
| Sample median | 2.25993 |
0 |
0 |
56.529 |
9.68167 |
0.1787 |
| 25% quantile | 1.48855 |
0 |
0 |
42.2776 |
3.5 |
0.0601 |
| 10% quantile | 0.94515 |
0 |
0 |
31.0449 |
0.7 |
0.0066 |
| Sample minimum | 0.04984 |
0 |
0 |
5.49288 |
0 |
0 |
| Sample coefficient of variation | 55.319106 |
155.7413 |
143.9354 |
43.798729 |
106.7871 |
91.4822 |
| Sample Skewness | 0.975 |
2.255 |
1.2772 |
0.7007 |
1.6455 |
0.9473 |
| 4.2: Building means | ||||||
Building means (n = 7) |
Mean Turns (Mean Depth -1) |
Turns to nearest overview tile |
Turns to nearest overview tile/mean turns |
Mean path distance (m) |
Distance to nearest overview tile (m) |
Distance to nearest overview tile/mean path distance |
| Sample mean- mean | 1.991 | 0.461 | 0.172 | 43.47 | 11.394 | 0.278 |
| Sample maximum mean | 5.02 | 1.728 | 0.445 | 101.691 | 41.52 | 0.64 |
| 90% quantile | 3.331 | 0.887 | 0.338 | 80.29 | 21.564 | 0.432 |
| 75% quantile | 2.53 | 0.643 | 0.231 | 57.224 | 16.212 | 0.368 |
| Sample median mean | 1.847 | 0.416 | 0.16 | 43.09 | 9.264 | 0.27 |
| 25% quantile | 1.319 | 0.203 | 0.099 | 25.262 | 5.933 | 0.155 |
| 10% quantile | 0.667 | 0.102 | 0.056 | 13.216 | 3.821 | 0.1 |
| Sample minimum mean | 0.172 | 0 | 0 | 7.5 | 2.949 | 0.077 |
| Sample coefficient of variation | 51.492 | 74.021 | 56.426 | 54.261 | 65.819 | 49.717 |
| Sample Skewness of mean | 0.69 | 1.299 | 0.67 | 0.546 | 1.498 | 0.636 |
Appendix 1. Simplified numerical profile of the sample of buildings
Building |
Estimated area (m2) |
Mean relative direct purview |
Max relative direct purview |
Mean path distance (m) |
Mean path elongation |
Mean distance/turn (m) |
Mean turns to nearest overview tile |
Mean distance to nearest overview tile (m) |
Mean turns |
| Altes Museum | 3401.58 | 0.08 | 0.19 | 48.1 | 0.22 | 28.73 | 0.23 | 9.22 | 1.72 |
| Altes Pinakothek | 3403.54 | 0.09 | 0.25 | 58.38 | 0.06 | 40.61 | 0.2 | 6.78 | 1.51 |
| Atheneum | 405.23 | 0.11 | 0.29 | 21.04 | 0.59 | 9.47 | 0.92 | 9.96 | 2.27 |
| Attalos Stoa | 1946.77 | 0.33 | 0.5 | 39.99 | 0.03 | 59.31 | 0.08 | 6.05 | 0.74 |
| Baden Vocational School | 2161.88 | 0.06 | 0.15 | 48.65 | 0.3 | 23.53 | 0.15 | 4.82 | 2.17 |
| Baker House | 1400.42 | 0.04 | 0.15 | 46.25 | 0.3 | 15.24 | 0.78 | 12.02 | 3.11 |
| Barcelona Pavilion | 549.29 | 0.23 | 0.44 | 19.96 | 0.17 | 17.96 | 0.27 | 9.15 | 1.17 |
| Barranca Museum | 5587.47 | 0.11 | 0.25 | 52.67 | 0.19 | 33.55 | 0.48 | 22.12 | 1.63 |
| Bazaar Kashan | 11207.28 | 0.03 | 0.11 | 93.36 | 0.39 | 32.01 | 0.66 | 26.51 | 3 |
| Bellevue Hospital | 1614.55 | 0.06 | 0.25 | 46.04 | 0.13 | 28.59 | 0.15 | 4.03 | 1.78 |
| Berlin Philharmonie | 4165.49 | 0.04 | 0.15 | 52.1 | 0.33 | 16.01 | 0.88 | 18.58 | 3.33 |
| Biel Engineering School | 1812.02 | 0.08 | 0.2 | 37.73 | 0.18 | 22.36 | 0.21 | 6.35 | 1.74 |
| Caravanserai Chaleh Siah | 5529.16 | 0.22 | 0.5 | 44.58 | 0.08 | 38.17 | 0.43 | 18.05 | 1.32 |
| Centraal Beheer | 3571.61 | 0.04 | 0.09 | 53.22 | 0.25 | 20.24 | 0.28 | 7.28 | 2.68 |
| Chandigarh Administration Building | 4639.81 | 0.07 | 0.2 | 88.57 | 0.04 | 36.62 | 0.31 | 8.8 | 2.47 |
| Delos Hill House | 263.13 | 0.31 | 0.53 | 9.76 | 0.07 | 13.14 | 0.1 | 3.26 | 0.77 |
| Dublin Methodist Hospital OH | 3751.93 | 0.02 | 0.08 | 70.72 | 0.51 | 18.3 | 0.42 | 6.58 | 3.96 |
| Evelyn Grace Academy | 2159.43 | 0.05 | 0.2 | 52.66 | 0.17 | 22.71 | 0.3 | 5.65 | 2.38 |
| Exeter Library | 589.96 | 0.39 | 0.67 | 13.86 | 0.04 | 23.39 | 0.1 | 5.65 | 0.66 |
| Fallingwater | 191.1 | 0.33 | 0.59 | 10.18 | 0.1 | 11.65 | 0.2 | 3.69 | 0.94 |
| Farnese Palace | 3582.88 | 0.17 | 0.43 | 38.26 | 0.12 | 28.57 | 0.57 | 16.21 | 1.43 |
| Fratte Monastery | 2643.06 | 0.22 | 0.39 | 33.41 | 0.15 | 27.09 | 0.47 | 11.72 | 1.31 |
| Ghana1 Nangodi compound | 807.03 | 0.05 | 0.17 | 23.68 | 0.36 | 8.75 | 0.84 | 9.24 | 2.77 |
| Hagia Sophia | 5731.04 | 0.35 | 0.58 | 42.26 | 0.01 | 66.58 | 0.16 | 18.15 | 0.67 |
| Helsingor Clinic | 3048.78 | 0.03 | 0.14 | 50.41 | 0.23 | 20.75 | 0.43 | 5.59 | 2.53 |
| Heraion1 Samos | 145.53 | 0.6 | 0.76 | 10.65 | 0 | 27.71 | 0.02 | 3.12 | 0.4 |
| Heraion2 Samos | 1190.7 | 0.28 | 0.5 | 22.77 | 0.71 | 21.12 | 0.5 | 9.45 | 1.13 |
| High Museum of Art | 902.09 | 0.06 | 0.22 | 28.04 | 0.19 | 12.18 | 0.61 | 6.93 | 2.39 |
| Lambeth Community Clinic | 604.66 | 0.11 | 0.3 | 19 | 0.12 | 13.29 | 0.67 | 6.94 | 1.5 |
| Larkfield Hospital, Greenock Royal Infirmary | 646.31 | 0.12 | 0.35 | 23.6 | 0.12 | 16.06 | 0.29 | 3.85 | 1.61 |
| Lesser Propylea Eleusis | 206.29 | 0.53 | 0.78 | 8.27 | 0.04 | 19.69 | 0.07 | 5.42 | 0.49 |
| Leutschenbach School | 1570.45 | 0.09 | 0.2 | 25.26 | 0.11 | 18.32 | 0.22 | 6.05 | 1.41 |
| Maggiore (Santa Maria de Maggiore Basilica) | 4207.14 | 0.12 | 0.35 | 45.03 | 0.22 | 25.59 | 0.66 | 14.99 | 1.91 |
| Manchester City Hall | 3890.11 | 0.05 | 0.16 | 48.98 | 0.17 | 24.8 | 0.64 | 15.58 | 2.05 |
| MAXXI | 4452.63 | 0.12 | 0.37 | 74.37 | 0.24 | 42.3 | 0.53 | 21.43 | 1.9 |
| Musashino Library | 1752.73 | 0.19 | 0.43 | 26.81 | 0.07 | 24.01 | 0.26 | 10.9 | 1.19 |
| Nasher Sculpture Gallery | 1450.89 | 0.16 | 0.41 | 26.71 | 0.23 | 19.31 | 0.31 | 8.4 | 1.44 |
| National Gallery | 6121.08 | 0.05 | 0.15 | 62.04 | 0.16 | 31.56 | 0.42 | 12.52 | 2.04 |
| Nelson Atkins Museum | 5806.01 | 0.08 | 0.2 | 94.79 | 0.06 | 34.22 | 0.53 | 20.21 | 2.84 |
| Nestor's Palace | 1139.25 | 0.08 | 0.23 | 26.61 | 0.27 | 11.19 | 0.87 | 11.28 | 2.48 |
| NHM | 10186.61 | 0.04 | 0.18 | 81.78 | 0.21 | 33.23 | 0.73 | 30.35 | 2.59 |
| Paimio Sanatorium | 2344.16 | 0.09 | 0.32 | 65.36 | 0.27 | 25.31 | 1.38 | 41.52 | 2.71 |
| Pantheon | 2153.55 | 0.56 | 0.78 | 29.2 | 0.05 | 62.13 | 0.23 | 10.49 | 0.61 |
| Parthenon | 2045.26 | 0.1 | 0.2 | 46.62 | 0.68 | 28.49 | 0.17 | 7.17 | 1.68 |
| Pentonville Prison | 3281.53 | 0.07 | 0.41 | 65.23 | 0.25 | 39.03 | 0.34 | 21.18 | 1.81 |
| Piedmont Hospital SC | 17788.47 | 0.01 | 0.04 | 104.69 | 0.27 | 21.37 | 1.05 | 16.44 | 5.02 |
| SAS | 8616.65 | 0.05 | 0.21 | 78.07 | 0.15 | 32.91 | 0.62 | 16.69 | 2.53 |
| Scottish Parliament | 6907.04 | 0.02 | 0.09 | 79.92 | 0.43 | 18.54 | 1.23 | 22.23 | 4.41 |
| Selinus G | 5202.82 | 0.18 | 0.35 | 57.22 | 0.33 | 52.65 | 0.2 | 14.04 | 1.14 |
| Sendai Mediatheque | 1880.62 | 0.11 | 0.28 | 27.58 | 0.15 | 20.49 | 0.39 | 9.61 | 1.38 |
| SmithCarter | 1818.88 | 0.04 | 0.18 | 37.23 | 0.11 | 17.58 | 0.5 | 5.93 | 2.21 |
| St Joseph's Hospital MN | 2850.33 | 0.02 | 0.12 | 52.7 | 0.21 | 18.37 | 0.53 | 9.26 | 2.95 |
| St Joseph's Hospital WI | 1930.11 | 0.03 | 0.1 | 40.49 | 0.24 | 13.95 | 0.12 | 3.1 | 2.95 |
| Stockholm Public Library | 1511.65 | 0.15 | 0.39 | 29.87 | 0.22 | 17.14 | 0.86 | 14.13 | 1.85 |
| St Thomas Hospital North Wing | 3577 | 0.02 | 0.09 | 43.66 | 0.28 | 18.15 | 0.15 | 4.38 | 2.49 |
| Tallinn City Hall | 5078.36 | 0.03 | 0.08 | 61.43 | 0.18 | 14.41 | 1.07 | 17.6 | 4.3 |
| Tholos Agora Athens | 210.21 | 0.83 | 0.92 | 7.5 | 0 | 47.44 | 0 | 2.95 | 0.17 |
| ThoughtForm | 1484.21 | 0.05 | 0.18 | 32.11 | 0.15 | 17.14 | 0.26 | 4.65 | 1.95 |
| Tiryns | 3109.05 | 0.14 | 0.37 | 50.01 | 0.36 | 16.75 | 1.73 | 25.84 | 3.33 |
| Tjibaou Cultural Center | 3989.09 | 0.07 | 0.24 | 84.39 | 0.11 | 43.52 | 0.45 | 8.57 | 2.1 |
| Trinita Pellegrini | 3103.66 | 0.06 | 0.19 | 40.6 | 0.19 | 17.24 | 0.47 | 11.37 | 2.45 |
| VafeioTomb | 157.78 | 0.63 | 0.95 | 15.38 | 0.01 | 59.24 | 0.01 | 10.47 | 0.38 |
| VillaRotonda | 752.64 | 0.12 | 0.28 | 18.19 | 0.16 | 12.72 | 0.19 | 4.16 | 1.48 |
| VillaSavoye | 339.08 | 0.2 | 0.5 | 13.86 | 0.39 | 9.41 | 0.77 | 9.35 | 1.63 |
| Volta1 | 112.7 | 0.18 | 0.35 | 8.4 | 0.38 | 6.1 | 0.38 | 3.57 | 1.42 |
| WesleyWoods | 4342.87 | 0.01 | 0.05 | 59.19 | 0.32 | 14.7 | 0.58 | 6.86 | 4.11 |
| WillisFaberDumas | 5581.1 | 0.27 | 0.55 | 43.09 | 0.05 | 51.28 | 0.28 | 18.91 | 0.92 |