How Complex are neuronal Interactions?
Accepted June 13, 2012
Keywords
brain networks, neural networks, maximum entropy, functional connectivity, correlations, pairwise interactions, high-order interactions
Abstract
A fundamental goal of systems neuroscience is to understand how the collective dynamics of neurons encode sensory information and guide behavior. To answer this important question one needs to uncover the network of underlying neuronal interactions. Whereas advances in technology during the last several decades made it possible to record neural activity simultaneously from a large number of network elements, these techniques do not provide information about the physical connectivity between the elements being recorded. Thus, neuroscientists are challenged to solve the inverse problem: inferring interactions between network elements from the recorded signals that arise from the network connectivity structure. Here, we review studies that address the problem of reconstructing network interactions from high-dimensional datasets generated by modern techniques, and focus on the emerging theoretical models capable of capturing the dominant network interactions of any order. These models are beginning to shed light on the structure and complexity of neuronal interactions.
Introduction
Progress made in the past several decades concerning the understanding of the central nervous system clearly indicates that higher brain functions such as perception, cognition, and motor control are performed by ensembles of synaptically interacting neurons acting in a concerted fashion as a network (Sporns 2010). Correspondingly, many neuropathological conditions resulting in various impairments are ultimately caused by disruptions in network interactions, mostly due to pathological changes in synapses, neurons, or both (Palop et al. 2006).
Interactions between neurons span across multiple spatial scales ranging from the microscale of single neurons and synapses, to the mesoscale of functional columns and their projections, and to the macroscale of brain regions and pathways. During perception, cognition, or motor action, individual neurons exhibit complex dynamic activities that result from these network interactions. Consequently, understanding how the collective dynamics of neurons encode sensory information and guide behavior, which is a fundamental problem of systems neuroscience, requires the knowledge of the network of underlying neuronal interactions.
While electrical properties of single neurons and synapses have been extensively studied, the progress in understanding the electrophysiology at the network level has been much slower. Studies of brain network activity require simultaneous recordings from multiple spatially distributed sites covering a sufficiently large area to ensure that the electrical activity of a representative part of the underlying neuronal network is recorded. In recent decades, more researchers have begun to use, instead of a single microelectrode, an array of microelectrodes that allows simultaneous recordings from considerably larger neuronal ensembles (Nicolelis 2007), both at the level of individual neurons (single-unit spikes) and at the level of local populations of neurons (multi-unit spikes and local field potentials [LFPs]). Since the 1950s, the number of network elements simultaneously recorded at higher spatial resolutions has nearly doubled every 7 years (Stevenson and Kording 2011). Regarding studies of neural activity at lower spatial resolutions, modern brain imaging techniques such as functional magnetic resonance imaging (fMRI) and magnetoencephalography (MEG) allow simultaneous recordings from a large number of network elements as well. Thus, advances in technology are leading to an explosion in the amount of neural data that are now being collected in experiments. Nevertheless, large volumes of such data alone do not guarantee progress in the understanding of brain network function. The point is that current techniques record only simultaneous activity of network elements but in essence do not provide information about the physical connectivity between them. As a result, how to translate these multidimensional neural activity data into knowledge about neuronal interactions and network function is a highly nontrivial problem. Therefore, it is important for the field of systems neuroscience to develop analytical approaches that are able to utilize the fundamentally new type of information about brain activity provided by simultaneous recordings from a large number of network elements both at higher and lower spatial resolutions.
There are two basic issues in this regard. First, most of the analytical tools developed earlier are suitable for dealing with one tiny part of the network represented by a few elements at a time and, as a result, they are ineffective in capturing the collective properties of several tens to a hundred continuously interacting elements that are being recorded in current neurophysiological experiments. To make use of such multidimensional data, approaches providing computationally tractable yet phenomenologically accurate models are necessary. Second, even though recordings from increasingly larger sub-networks of elements are becoming possible, these sub-networks still represent only small parts of functional networks, which are composed of thousands to millions of elements. Thus, the computational models should provide adequate descriptions not only for smaller sub-networks being recorded but also when these models are extrapolated to significantly larger network sizes.
Understanding neuronal interactions from pairwise activity correlations
A broad definition of neuronal interactions reflects a simple and intuitive idea that activity of one cell can affect the activity of another cell, or, in other words, the firing of neurons is not statistically independent. Such a definition, also referred to as functional connectivity, implies that interactions between a pair of neurons can be due to direct monosynaptic or indirect polysynaptic physical connections. For many decades, correlation between the time series of activity of neurons (Perkel et al. 1967; Gerstein and Perkel 1969) has been used as a basic measure for the quantification of the strength of interaction. For example, correlation analysis was used to infer interactions between local neurons in auditory (Dickson and Gerstein 1974) and visual (Ts'o et al. 1986) cortices, or between the visual cortex and the thalamus (Sillito et al. 1994; Reid and Alonso 1995).
Although studies based on pairwise correlations provide important insights into cortical signal processing, the interpretation of raw correlation values as a measure of intra-network interaction can be problematic. Indeed, correlations between neurons can be caused not only by internal interactions but also by external factors acting upon them. For instance, common inputs can lead to trial-to-trial co-variation in response latency and/or excitability. In such cases, the recipient neurons, even in the absence of direct or indirect network interactions between them, will exhibit activity correlations similar to those of interacting neurons (Brody 1999). Co-variation between activities of neurons can also be caused, for example, by slow changes of state of the underlying system resulting in co-varying drifts (i.e., non-stationarities) in neural activity. From the point of view of network interactions, these externally induced correlations, irrespective of their sources, should be treated as spurious, and it is highly desirable to remove their effects from the correlations that arise from intra-network interactions. A few methods (e.g., Gerstein and Perkel 1969; Brody 1999) that rely on time series correlations obtained under different stimulus conditions allow, with limited accuracy, to differentiate between correlations arising from external co-variates and correlations due to internal interactions.
A similar problem as to how two time series relate to each other arises also in econometrics, for example, when considering the usefulness of one economic series in forecasting of another series. Interestingly, in this field too, it was recognized that naive interpretation of raw correlations between series as a measure of their relatedness can result in serious errors, for example, false forecasting (Box and Newbold 1971; Granger and Newbold 1974). The point is that economic time series are usually non-stationary, a phenomenon that is, in general, also inherent in time series of neural activity. As mentioned above, non-stationarities may result in spurious correlations. The other crucial point is that many economic time series studies collected data over relatively short time spans (an order of 100 samples). Thus, even assuming that the raw time series had been stationary, correlations should be estimated from experimental samples of limited length. However, finite sample lengths could highly inflate or deflate the estimated correlation values when the series themselves are auto-correlated (Jenkins and Watts 1968; Box and Newbold 1971; Haugh 1976). In fact, because the correlation estimation errors are affected by the magnitude of autocorrelations of individual series, in some special cases even fairly long sequences of samples of entirely unrelated time series may exhibit large correlations, all of them spurious (see an illustrative example in Jenkins and Watts 1968, pp 338-339). This crucial point is also relevant to the analysis of time series of neural activity and, if unacknowledged, may result in misleading conclusions. For example, one may erroneously assign significance to correlation estimates that have apparently high values, but which in fact occur entirely spuriously, simply due to the limited sampling of the underlying series and the presence of an autocorrelation structure.
The problems arising from non-stationarity, the finite sample length and presence of an autocorrelation structure in experimentally obtained data can be properly treated by using, for example, the methods of time series analysis pioneered by Box and Jenkins (1970). The key idea is to model individual series as a stochastic process driven by a white noise. The relation between the observed series is then essentially determined by correlations between the corresponding white noise series. Importantly, these correlations can now be reliably estimated, even from relatively short samples, because the white noise series do not have an autocorrelation structure. Such an approach, which is suitable for continuous neural signals sampled at equal time intervals, has been adopted in a number of recent studies of functional connectivity at large spatial scales based on MEG (Georgopoulos et al. 2007), fMRI (Christova et al. 2011), and LFP (Christopoulos et al. 2012) signals. In this framework, the model parameters are optimized to capture the temporal structure of the observed series. Then, the residuals (estimates of noise) that generate the observed series from the fitted model are calculated. If the model is adequate, the residuals should be close to a white noise. The key feature of this approach is that it allows spurious correlations caused by homogeneous non-stationarities and/or autocorrelations to be explained away as effects of the fitted stochastic processes, so that interactions between the observed time series are attributed solely to correlations between the white noise series (residuals) driving these processes.
Suppose now that a neuronal network is not affected by external factors and that samples of neural activity are stationary and sufficiently long, so that raw correlations between pairs of such samples can be accurately estimated. Since the factors mentioned above that can potentially cause spurious correlations are no longer present, it is tempting to assume that in this well-behaved case raw correlation values are appropriate measures of intra-network interactions and there is no need to model individual series to quantify these interactions. Indeed, in this case, if two neural signals A and B are independent, then raw correlation, ρAB, between the sequences of activity samples will be close to zero as correlation between the respective white noise series, ωAB , derived from the stochastic models of A and B: ρAB = ωAB = 0. However, what if there is an interaction (via direct or indirect network connections) between A and B? In this case, both ρAB and ωAB will be different from zero, but not equal to each other. Which of these two measures provides a better description of network interactions? One may argue that a good measure of interaction should be independent of internal autonomous properties of interacting units. The point is that, in this case, the magnitude of interaction between one pair of units in the network can be directly compared with the magnitude of interaction between another pair. In this regard, it should be noted that raw correlation ρAB between series A and B, in general, depends on the autocorrelations of individual series ρAA and ρBB that, respectively, quantify internal properties of A and B (captured by the corresponding models). This is different from correlation ωAB between the white noise series generating activities of A and B because any white noise series, by definition, does not have an autocorrelation structure. Therefore, raw correlation, ρAB , unlike the corresponding white noise correlation ωAB , is not a good measure of interaction. To further illustrate this point, consider a second interacting pair of neural signals C and D that is characterized by raw correlation ρCD and the corresponding white noise correlation ωCD. In the context of network interactions, if correlation between the white noise series generating activities A and B is the same as correlation between the white noise series generating activities C and D, i.e., ωAB = ωCD , then it would be reasonable to equate the strength of interaction between A and B with the strength of interaction between C and D. Note that raw correlations ρAB and ρCD, which are contaminated by the internal autonomous properties of the interacting units, will not be equal in this case.
In conclusion, regardless of whether raw correlations can be reliably estimated from experimental samples, they are not appropriate for the quantification of intra-network interactions. Such interactions, however, can be meaningfully quantified by correlations between the generating series that drive stochastic models fitted into experimental samples. It should be noted that the neuroscience community, at large, remains mostly ignorant about the pitfalls of using raw correlations as a measure of functional connectivity in brain networks.
Network Model Based Approach
The pairwise approach to intra-network connectivity has limitations that become evident in networks with three or more neurons. For example, if neuron A is connected to neuron B and neuron B is connected to neuron C, then activities of all three neurons will be considerably correlated. However, relying on the pairwise consideration alone it would be impossible to know that the interaction between A and C is, in fact, facilitated by B. As a result, we would be unable to separate the direct interaction between A and C from the contributions made by the interactions between A and B, and B and C, an important piece of information. This and similar problems arise because the pairwise approach, by considering only two neurons at a time, intends to account for just one network interaction (among the vast number of other interactions) that is consistent with the activities of the observed pair of neurons (thus ignoring the activities of unobserved neurons). Such a simplified approach provides considerably limited and inaccurate information about network structure and organization.
Since modern techniques allow simultaneous recordings from significantly larger populations of neurons, recently the theoretical framework has been extended beyond the pairwise consideration to provide a more accurate reconstruction of intra-network interactions. In general, a better approximation of functional connectivity can be achieved by constructing a network model that concurrently considers interactions between every pair of simultaneously recorded neurons. Such an approach allows, in principle, correlations between indirectly connected neurons (A and C in the example above) to be explained away by a chain of direct interactions (connections from A to B and from B to C) involving other neurons (B).
For describing neural spiking activity in network-based models, a number of studies used a point process framework (Chornoboy et al. 1988; Brillinger et al. 1988) in which model parameters are optimized by applying the maximum likelihood principle to render the observed multi-neuron spikes as the most likely outcome of the model. In contrast to the pairwise approach, in this consideration the spiking probability of one neuron is determined by the concurrent interactions with all other recorded neurons, not just one of them. Additionally, it allows inclusion of several other factors that can simultaneously affect the neuron's firing probability, for example, a recent (< 100 ms) spiking history of the observed neuronal population and external co-variates associated with sensory stimuli and behavior (Okatan et al. 2005; Truccolo et al. 2005, 2010). While the point process network likelihood approach focuses on the spatiotemporal collective dynamics and has provided valuable models for revealing such dynamics in ensembles of hippocampal (Okatan et al. 2005) and motor cortical neurons (Truccolo et al. 2005), it is not intended to provide minimal models for dynamics description (Truccolo et al. 2010). Therefore, as the system's dimension (i.e., the size of observed neuronal population) increases, the number of model parameters soon outgrows the number of feasibly collectible experimental samples. Consequently, methods based on this approach often over-fit the data and an accurate estimation of these parameters becomes impossible, a computational challenge known as the curse of dimensionality. Recently, it has been shown that a Bayesian inference that combines the likelihood of experimentally observed multi-neuron spikes with the assumptions about prior probabilities of the underlying parameters can reduce over-fitting and improve inference of these parameters (Stevenson et al. 2009). However, this approach also does not directly address the problem of minimal models of network interactions that satisfy all correlations simultaneously, which is an important and principal question on its own.
How Can We Circumvent
the curse of Dimensionality?
The main difficulty in deriving a computationally parsimonious mathematical description for large neuronal ensembles lies in determining a sufficiently accurate probability distribution over the space of multi-neuron spike firing patterns. This could potentially be achieved if it would be possible to effectively reduce the dimensionality of the dataset while retaining the relevant dimensions. The general approach used in this field is formulated as follows: The spike trains recorded from N neurons are divided into small time bins Δt, so that the activity of neuron i could be represented by a binary variable σi(t) that can take on only two values, +1 if one or more spikes are present in the time bin t, and -1 otherwise. The state σN(t) of the network at a given time bin t can then be described as σN(t) = {σ1(t), σ2(t), ... σN(t)}. Thus, there are 2N states, each state corresponding to one of the possible N-neuron spike firing patterns. In general, this system can be described by 2N -1 parameters providing the probabilities of occurrence of each pattern. A large volume of the space of network states, however, makes it impractical to construct the exact probability distribution from experimental data because the number of required measurements grows exponentially, as 2N, with neuronal population size N. However, it could be possible to build an approximate distribution P(σN) by using a low-dimensional parameterization. The parameters should be determined from the experimental data, but the required number of measurements will now scale with the number of parameters (power law of N) rather than with the volume of the network states (exponential law of N).
The Maximum Entropy Pairwise Model
One may think that low-dimensional parametric models, although computationally tractable, are so inaccurate that they would be of little practical interest. Nevertheless, recent studies (Schneidman et al. 2006; Shlens et al. 2006, 2009; Tang et al. 2008; Yu et al. 2008; Cocco et al. 2009) suggest that surprisingly accurate statistical descriptions can be achieved in the framework of parametric models known as maximum entropy binary pairwise models. The binary pairwise models find probability distributions P(σN) that are consistent with the mean firing rates 〈σi(t)〉 of neurons and all pairwise correlations 〈σi(t)σj(t)〉. However, for each given set of means and correlations there is an infinite number of such models. Among them, the maximum entropy model is the one that has the least structured probability distribution (hence the maximum entropy). The least structured implies that the distribution assumes no higher-order (than second, i.e., pairwise) interactions. Importantly, these are in essence spatial interactions because they are determined by the instantaneous states of the neurons (i.e. in the same time bin t).
Maximum entropy models originate from information theory as a parsimonious method for setting up probability distributions (Cover and Thomas 1991). As it was elucidated by Jaynes (1957), in general, there is a natural connection between information theory (Shannon 1948) and statistical mechanics. Particularly, second-order maximum entropy models are analogous to the Ising models introduced in statistical physics for the description of properties of magnetic materials (Landau and Lifshitz 1980). To compute the probability distribution of patterns provided by the maximum entropy pairwise model, Schneidman et al. (2006) and Tang et al. (2008) explicitly mapped neuron firing rates and pairwise correlations onto magnetizations and spin-spin correlations in the Ising model. Specifically, the energy (σN ) of an ensemble of N neurons in state σN is given by:
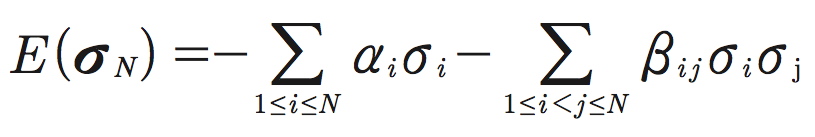
Here αi and βij are the model parameters: αi characterizes the intrinsic property of neuron i to fire spikes, whereas βij describes the pairwise interaction between neurons i and j. These parameters are analogous to the local magnetic fields and spin-spin couplings, respectively, in the Ising model. The second-order maximum entropy distribution then takes the form:
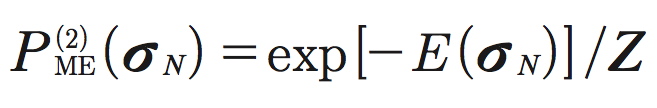
where ![]() is a normalization factor (partition function). In this framework, the mean firing rates and pairwise correlations are computed as corresponding averages 〈σi〉 and 〈σiσj〉 over the distribution
is a normalization factor (partition function). In this framework, the mean firing rates and pairwise correlations are computed as corresponding averages 〈σi〉 and 〈σiσj〉 over the distribution ![]() . Note, the mean firing rates 〈σi〉 and the pairwise correlations 〈σiσj〉 are experimentally observable quantities, and they are different and should be distinguished from the intrinsic firing properties αi and the pairwise interactions βij , which are the model parameters.
. Note, the mean firing rates 〈σi〉 and the pairwise correlations 〈σiσj〉 are experimentally observable quantities, and they are different and should be distinguished from the intrinsic firing properties αi and the pairwise interactions βij , which are the model parameters.
In physics, one usually starts from the known parameters of the probability distribution (external fields and pairwise couplings) and then computes average values of observables (magnetizations and spin-spin correlations). However, in neuroscience, with the application of the Ising model to neuron-neuron interactions, one should solve the inverse problem, starting from the known observables, neuron firing rates and pairwise correlations, and then compute the model parameters, the intrinsic firing properties {αi} and the pairwise interactions {βij}. There are several computationally efficient methods for solving the inverse Ising problem (see, e.g., Cocco et al. 2009; Ganmor et al. 2011a).
The parameters of the maximum entropy model are fully defined by the set of N mean firing rates and the N(N - 1)/2 pairwise correlations, which could be obtained experimentally. As a result, the number of measurements required to determine the full probability distribution ![]() scales quadratically with the number of neurons N (i.e., power law N2), not exponentially (2N).
scales quadratically with the number of neurons N (i.e., power law N2), not exponentially (2N).
How Good is the Pairwise Model?
The maximum entropy binary pairwise approach was applied to the probability distributions of multi-neuron spike firing patterns for the first time in studies of salamander and guinea pig retinas (Schneidman et al. 2006) and primate retina (Shlens et al. 2006). Retinal ganglion cells were stimulated either by natural movies (Schneidman et al. 2006), or by steady spatially uniform illumination, or white noise (Shlens et al. 2006). The performance of the pairwise model was evaluated in these studies by comparing the probability distribution of spike firing patterns predicted by the model, ![]() , with the distribution of patterns observed experimentally,
, with the distribution of patterns observed experimentally, ![]() . The discrepancy between the two distributions could be measured as the entropy difference
. The discrepancy between the two distributions could be measured as the entropy difference ![]() , where the entropy S of a distribution P(x) is
, where the entropy S of a distribution P(x) is ![]() . To appreciate the scale of discrepancy, one also needs to introduce a meaningful unit of measurement; these studies used the entropy difference,
. To appreciate the scale of discrepancy, one also needs to introduce a meaningful unit of measurement; these studies used the entropy difference, ![]() . Here,
. Here, ![]() is the entropy of the independent model that is simply a first-order maximum entropy model in which all interactions are set to zero: βij = 0. It produces a probability distribution
is the entropy of the independent model that is simply a first-order maximum entropy model in which all interactions are set to zero: βij = 0. It produces a probability distribution ![]() that has the same mean rates 〈σi〉 as observed in the data but assumes that the firing of each neuron is independent from the others. The model performance, thus, could be measured by the ratio
that has the same mean rates 〈σi〉 as observed in the data but assumes that the firing of each neuron is independent from the others. The model performance, thus, could be measured by the ratio ![]() . If it is small (ΔN « 1), then the pairwise model approximates the true distribution very well. In contrast, if ΔN is close to 1, then it provides no improvement over the independent model. Schneidman et al. (2006) demonstrates that for an ensemble N = 10 cells, the pairwise model is approximately 10 times more efficient in capturing the statistics of multi-neuron spike patterns than the independent model (Δ10 ≅ 0.1). For the preparations studied by Shlens et al. (2006), the pairwise model shows almost a 100-fold improvement over the independent model for N = 7 (Δ7 ≅ 0.01). Results of these first two studies were further confirmed for multi-neuron spike patterns observed during spontaneous activity of cortical neurons in slices and organotypic cultures (Tang et al. 2008), dissociated cultures (Schneidman et al. 2006; Tang et al. 2008), as well as during stimulus-driven activity of neurons in the visual cortex of anesthetized cats (Yu et al. 2008) and monkeys (Ohiorhenuan et al. 2010).
. If it is small (ΔN « 1), then the pairwise model approximates the true distribution very well. In contrast, if ΔN is close to 1, then it provides no improvement over the independent model. Schneidman et al. (2006) demonstrates that for an ensemble N = 10 cells, the pairwise model is approximately 10 times more efficient in capturing the statistics of multi-neuron spike patterns than the independent model (Δ10 ≅ 0.1). For the preparations studied by Shlens et al. (2006), the pairwise model shows almost a 100-fold improvement over the independent model for N = 7 (Δ7 ≅ 0.01). Results of these first two studies were further confirmed for multi-neuron spike patterns observed during spontaneous activity of cortical neurons in slices and organotypic cultures (Tang et al. 2008), dissociated cultures (Schneidman et al. 2006; Tang et al. 2008), as well as during stimulus-driven activity of neurons in the visual cortex of anesthetized cats (Yu et al. 2008) and monkeys (Ohiorhenuan et al. 2010).
These studies generated a lot of excitement because they all suggest that the maximum entropy pairwise model could be amazingly effective. It appears that, regardless of the preparations studied, the second-order spatial interactions are sufficient for a fairly accurate description of the statistics of multi-neuron spike firing patterns and, as a result, the contributions from all higher-order interactions could be simply neglected. Such a dramatic simplification would make this apparently intractable, exponentially large problem rather tractable with a quadratically small number of required measurements for the system description. However, there are at least two problems that need to be addressed to understand the limits of the maximum entropy pairwise approach. The first problem concerns the extrapolation of the model to large N. The second problem concerns the temporal correlations between the multi-neuron spike-firing patterns σN (t) observed in successive time bins t.
The Extrapolation Problem
The fact that the pairwise model provides a good description of the statistics of multi-neuron spike firing patterns is fascinating and important, not only because it radically simplifies the system but also because it could have deep-rooted implications for the understanding of network structure and function. For example, Schneidman et al. (2006) suggests that the pairwise spatial interactions in the retina create a mechanism for an error-correcting code. To arrive at this conclusion, though, the authors, using the maximum entropy pairwise model, have to extrapolate the quantities computed for smaller sub-networks to the whole network. However, as it was pointed out by Nirenberg and Victor (2007), the form of the extrapolation to large chosen by Schneidman et al. (2006) is somewhat arbitrary, and other extrapolations would have led to different conclusions.
The initial experimental support for the pairwise model was provided by small sub-networks; in most of the studies mentioned above the population size was on the order of 10 neurons. An important question is whether the conclusions reached from studies of smaller sub-networks will generalize to the full functional networks. Specifically, given that the maximum entropy distribution ![]() for a subset of n neurons predicts the statistics of patterns {σn}, will the distribution
for a subset of n neurons predicts the statistics of patterns {σn}, will the distribution ![]() produced now for the full set N » n of neurons also predict the statistics of the entire network patterns {σN }? The answer to this question is not trivial. In terms of ΔN, which quantifies the quality of fit of the maximum entropy pairwise model to the true distribution observed in the data, the extrapolation problem is the problem of computing ΔN in the limit of large N.
produced now for the full set N » n of neurons also predict the statistics of the entire network patterns {σN }? The answer to this question is not trivial. In terms of ΔN, which quantifies the quality of fit of the maximum entropy pairwise model to the true distribution observed in the data, the extrapolation problem is the problem of computing ΔN in the limit of large N.
Recent theoretical work by Roudi et al. (2009) showed that for an arbitrary true distribution ![]() the quality of fit ΔN can be computed in the perturbative regime defined by a small parameter Nv̅Δt, where v̅ is the average firing rate across the population. The authors computed ΔN using perturbative expansion in powers of Nv̅Δt in the limit Nv̅Δt « 1 The final result is quite simple: ΔN ≈ γ (N - 2)v̅Δt, where γ is a constant independent of N. The authors made two important conclusions. First, in the perturbative regime ΔN is always small. Therefore, in this regime the pairwise model, irrespective of the properties of the true distribution, will fit the data well. Second, to understand whether the model will be adequate for large systems (i.e., if ΔN will remain small as N increases further) one needs to consider values of N » 1/v̅Δt when the perturbative regime breaks down.
the quality of fit ΔN can be computed in the perturbative regime defined by a small parameter Nv̅Δt, where v̅ is the average firing rate across the population. The authors computed ΔN using perturbative expansion in powers of Nv̅Δt in the limit Nv̅Δt « 1 The final result is quite simple: ΔN ≈ γ (N - 2)v̅Δt, where γ is a constant independent of N. The authors made two important conclusions. First, in the perturbative regime ΔN is always small. Therefore, in this regime the pairwise model, irrespective of the properties of the true distribution, will fit the data well. Second, to understand whether the model will be adequate for large systems (i.e., if ΔN will remain small as N increases further) one needs to consider values of N » 1/v̅Δt when the perturbative regime breaks down.
These quite general theoretical results have important implications for the interpretation of experimental data. As it was pointed out by Roudi et al. (2009), experiments conducted in earlier studies (Schneidman et al. 2006; Shlens et al. 2006; Tang et al. 2008; Yu et al. 2008) operated close to the perturbative regime; the parameter Nv̅Δt in these studies was no greater than 0.4. Thus, the reason that the pairwise model explained the experimental data quite well in all of these studies is somewhat trivial; no matter what the structures of the underlying true distributions were, this would have happened anyway. Correspondingly, to answer the question of whether the pairwise model can be extrapolated to larger N, one needs to experimentally measure how ΔN depends on N past the perturbative regime. If ΔN saturates and remains small, then it would be reasonable to assume that the pairwise model could be extrapolated to the large N regime.
Recently, Ganmor et al. (2011b) clearly demonstrated that for larger networks that are beyond the perturbative regime the pairwise model becomes inaccurate and fails to capture network behavior. Specifically, they studied populations of salamander retinal neurons (N ≅ 100) responding to natural stimuli. The pairwise model significantly misestimated the probability of occurrence of the most common multi-neuron patterns, although it predicted fairly well the rare patterns. This suggests that the problem cannot be simply attributed to the poor experimental sampling of population activity patterns; rather, it is caused by a failure of the model itself. This, in turn, indicates that the contributions from higher than second-order interactions in larger networks become significant and that they cannot be neglected anymore if one needs to achieve an accurate description of network behavior.
The second-order maximum entropy model can be naturally extended to account for higher-order interactions (Amari 2001) by adding corresponding terms in the expression for the energy of the neuronal ensemble. For example, the third-order maximum entropy model will result in
![]()
where {γijk}is a set of parameters representing the third-order interactions and which must be found by matching the corresponding third-order activity correlations, i.e., averages 〈σiσjσk〉 over ![]() , to the experimental ones. Higher than second-order interactions quantify the tendency of groups of neurons forming triplets, quadruplets, etc., to fire synchronously beyond what can be explained by the pairwise model of the network.
, to the experimental ones. Higher than second-order interactions quantify the tendency of groups of neurons forming triplets, quadruplets, etc., to fire synchronously beyond what can be explained by the pairwise model of the network.
If the true distribution ![]() over all the network states was known, then it would have been straightforward to infer all (i.e., up to the N-th order) network interactions (Amari 2001). However, because the number of activity patterns grows exponentially with the system size N, experimental estimation of
over all the network states was known, then it would have been straightforward to infer all (i.e., up to the N-th order) network interactions (Amari 2001). However, because the number of activity patterns grows exponentially with the system size N, experimental estimation of ![]() for larger networks becomes practically impossible no matter how long one observes the system. Therefore, using only frequently occurring patterns Ganmor et al. (2011b) constructed a model that approximates the distribution
for larger networks becomes practically impossible no matter how long one observes the system. Therefore, using only frequently occurring patterns Ganmor et al. (2011b) constructed a model that approximates the distribution ![]() . The model learned the functional connectivity in the underlying network by allowing the inclusion of interactions of any order, if necessary. They found that this model provides significantly better description of the response of the retinal ganglion cells to different natural movies than the pairwise
. The model learned the functional connectivity in the underlying network by allowing the inclusion of interactions of any order, if necessary. They found that this model provides significantly better description of the response of the retinal ganglion cells to different natural movies than the pairwise ![]() model. These results do not contradict those reported in Shlens et al. (2009) who studied similar sized (N ≅ 100) networks of ganglion cells in primate retina but concluded that second-order models, in fact, are very successful in capturing the network responses. In this latter case the network was stimulated by spatiotemporal white noise, which, by definition, lacks any correlation structure, unlike naturally occurring scenes that are known to contain long-range correlations. Importantly, Ganmor et al. (2011b) demonstrates that as the stimulus becomes more correlated the network response becomes more correlated too, resulting in a growing contribution of higher-order interactions. They conclude, therefore, that the higher-order interactions are driven by the higher-order statistics in natural scenes. Importantly, the number of interaction parameters contributing to the model is much smaller than the number of all possible pairs, and these parameters correspond to low-order interactions, typically not exceeding the fifth-order.
model. These results do not contradict those reported in Shlens et al. (2009) who studied similar sized (N ≅ 100) networks of ganglion cells in primate retina but concluded that second-order models, in fact, are very successful in capturing the network responses. In this latter case the network was stimulated by spatiotemporal white noise, which, by definition, lacks any correlation structure, unlike naturally occurring scenes that are known to contain long-range correlations. Importantly, Ganmor et al. (2011b) demonstrates that as the stimulus becomes more correlated the network response becomes more correlated too, resulting in a growing contribution of higher-order interactions. They conclude, therefore, that the higher-order interactions are driven by the higher-order statistics in natural scenes. Importantly, the number of interaction parameters contributing to the model is much smaller than the number of all possible pairs, and these parameters correspond to low-order interactions, typically not exceeding the fifth-order.
Other recent studies (Montani et al. 2009; Ohiorhenuan et al. 2010; Santos et al. 2010) demonstrate that even in smaller networks, in which the pairwise models already capture much of the network behavior, the inclusion of higher-order interactions, in general, improves the statistical description of multi-neuron firing patterns. For example, significant third-order interactions were identified in a population (N = 38) of neighboring (< 300 μm) neurons in the macaque visual cortex (Ohiorhenuan et al. 2010), and up to the fourth-order interactions were present among neurons (N = 24) in the rat somatosensory cortex (Montani et al. 2009).
Finally, the contribution of third-order interactions to cortical dynamics such as ongoing neuronal avalanches (Beggs and Plenz 2003) is demonstrated by Yu et al. (2011) using the dichotomized Gaussian (DG) model (Amari et al. 2003, Macke et al. 2009, 2011). Particularly, it is shown that pairwise interactions alone fail to properly account for neuronal avalanche dynamics that characterize ongoing cortical activity in awake monkeys based on the LFP signal. However, the inclusion of a specific structure of higher-order interactions by means of the DG model improves the accuracy of the reconstructed neuronal avalanche statistics by up to two orders of magnitude.
The Temporal Correlations Problem
The maximum entropy pairwise model accounts for spatial interactions and predicts spike patterns for one time-bin only, assuming temporal independence of successive patterns. On the other hand, it has been shown that patterns of activity in populations of neurons are temporally correlated (Lindsey et al. 1997; Prut et al. 1998; Tsodyks et al. 1999; Ikegaya et al. 2004; Eytan and Marom 2006). Therefore, the validity of the temporal independence assumption depends on the duration of the time bin Δt; if it is small compared to the characteristic correlation time in the spike trains, then this assumption breaks. Consequently, even if the pairwise model successfully predicts the statistics of spatial patterns, this does not necessarily mean that it will also predict the temporal sequence of the patterns. Indeed, Tang et al. (2008) demonstrates that spike patterns predicted from the pairwise model that were concatenated in a temporally independent fashion failed to produce sequences of patterns that were observed experimentally, although the model provided a good fit to the observed statistics of the patterns in one time bin. The studies that examined the effectiveness of the pairwise model typically used Δt = 20ms. While this time bin could be acceptable in some cases, such as experiments that use non-natural stimuli with short correlation times (e.g., white noise in Shlens et al. 2006), it could be too short for other experimental paradigms in which temporal correlations in neural activity are observed on the scale of hundreds of milliseconds, as was the case of the spontaneous activity studied by Tang et al. (2008).
Recently, Marre et al. (2009) proposed a new approach that combines the maximum entropy binary pairwise model with a Markovian assumption to derive the joint probability distribution of spike patterns observed in two consecutive time bins. This approach essentially extended the maximum entropy pairwise model into the temporal domain by applying the framework of stationary Markov chains. Using this model one can compute the conditional probability distribution ![]() , which is the probability of transition from the spike pattern
, which is the probability of transition from the spike pattern ![]() in one time bin to the pattern
in one time bin to the pattern ![]() in the next time bin. These transition probabilities together with the stationary probabilities define the probability of observing any given sequence of T patterns
in the next time bin. These transition probabilities together with the stationary probabilities define the probability of observing any given sequence of T patterns ![]() . The Markov model is consistent not only with the mean firing rates of neurons 〈σi(t)〉 and the instant correlations 〈σi(t)σj(t)〉 as in the pairwise model, but also with the time-lagged correlations 〈σi(t)σj(t + Δt)〉. Consequently, this is the maximum entropy second-order model that accounts for distributed spiking activity based on both spatial and temporal interactions. The model parameters are fully defined by the set of N mean firing rates, the N(N - 1)/2 spatial, and N(N + 1)/2 temporal pairwise correlations, which could all be obtained experimentally. To solve the model numerically, Marre et al. (2009) proposed an elegant approach that in essence reduces the N–neuron Markov problem to solving the 2N–neuron maximum entropy pairwise problem. Consequently, to determine the parameters of the Markov model from experimental data one needs to solve the inverse Ising problem.
. The Markov model is consistent not only with the mean firing rates of neurons 〈σi(t)〉 and the instant correlations 〈σi(t)σj(t)〉 as in the pairwise model, but also with the time-lagged correlations 〈σi(t)σj(t + Δt)〉. Consequently, this is the maximum entropy second-order model that accounts for distributed spiking activity based on both spatial and temporal interactions. The model parameters are fully defined by the set of N mean firing rates, the N(N - 1)/2 spatial, and N(N + 1)/2 temporal pairwise correlations, which could all be obtained experimentally. To solve the model numerically, Marre et al. (2009) proposed an elegant approach that in essence reduces the N–neuron Markov problem to solving the 2N–neuron maximum entropy pairwise problem. Consequently, to determine the parameters of the Markov model from experimental data one needs to solve the inverse Ising problem.
Marre et al. (2009) tested this model on one small population of neurons (N = 8) recorded from the parietal cortex during sleep states and on synthetic data generated by the Glauber spin-glass dynamics. It remains unclear whether this approach can succeed if tested against larger networks.
The problem of temporal correlations is highly significant for several reasons. First, recent theoretical work (Roudi et al. 2009) showed that the pairwise model error due to ignoring temporal correlations is, in fact, larger than the error due to ignoring spatial correlations. Thus, to construct an accurate spatiotemporal probability distribution both spike firing patterns and their temporal evolution should be taken into account. Second, maximum entropy pairwise models that do not assume temporal independence are important not only because they improve the accuracy of the system description but they also could have deep-rooted implications for the understanding of network structure and function. For example, if the extended model proposed by Marre et al. (2009) turns out to be sufficiently accurate, then it suggests that temporal interactions in cortical networks are constrained by the Markov property, i.e., the probability distribution for the spike patterns at the next time bin only depends on the current network state (spike pattern). Also, this model has an additional set of parameters describing the transition probability from one state of the network at time bin t to another state at time bin t + 1. These parameters, which should be determined from the time-lagged pairwise correlations, are likely related to the underlying synaptic structure and could, therefore, provide significant insights into the network architecture and functional connectivity from experimentally measured quantities.
Concluding remarks
The structure of neuronal interactions ultimately defines the nature of the neural code, i.e., how activity patterns in networks of neurons encode sensory information and guide behavior. Because the number of all potential interactions (i.e., interactions of all orders) grows exponentially with the size of the network, the neuronal interaction structure, in general, could be arbitrarily complex. That is why the initial success of maximum entropy pairwise models in describing the strongly correlated activity in small groups of neurons (N ≤ 10) generated a lot of excitement; it appeared that first and second-order interactions alone provided a fairly accurate description of network behavior. This implied that contributions from all higher-order interactions are relatively small and, therefore, they can be effectively neglected, resulting in a dramatic simplification of the underlying system. More recent studies of larger networks (N > 20) demonstrate, however, that pairwise models account for much but not all of the network behavior. What is encouraging, though, is that even in the largest networks studied so far (N ≅ 100 retinal neurons) the number of interaction parameters in the models approximating the statistics of network activity patterns is much smaller than the number of parameters in the maximum entropy pairwise models, and these parameters correspond to low-order interactions, typically not exceeding the fifth-order (Ganmor et al. 2011b). Thus, even though in larger networks the pairwise models become inaccurate and fail to capture network behavior, the underlying structure of neuronal interactions remains relatively simple because interactions are sparse (i.e., few) and do not go to very high orders.
An important question that has yet to be answered is the relationship between the interactions inferred by network models (functional connections) and actual physical interactions (synaptic connections). Are these functional connections reflecting the physical properties of the underlying networks or are they simply chimeras of the model? Note that in neural systems the physical interactions are always pairwise. Also, in the network model considered by Ganmor et al. (2011b), the higher than second-order interactions arise because of correlations present in natural scene stimuli. While this model accounts for spatial correlations it disregards the presence of temporal correlations. However, recently it has been shown (Roudi et al. 2009) that the error due to ignoring temporal correlations is, in fact, larger than the error due to ignoring spatial correlations. It will be interesting to find out how accounting for temporal correlations in multi-neuron activity patterns affects higher-order interactions.
Although these and many other questions need to be answered, network model based studies have laid down important groundwork, suggesting that the situation may not be as hopeless as one may think. Ideas and approaches developed in these studies certainly promise to be useful and have the potential to provide significant insights into the architecture and function of brain networks.
Acknowledgements
This work was supported by the Department of Veterans Affairs, and American Legion Brain Sciences Chair.
References
Amari S (2001) Information geometry on hierarchy of probability distributions. IEEE Trans Inform Theory 47:1701-1711
Amari S, Nakahara H, Wu S, Sakai Y (2003) Synchronous firing and higher-order interactions in neuron pool. Neural Comput 15:127-142
Beggs JM, Plenz D (2003) Neuronal avalanches in neocortical circuits. J Neurosci 23:11167-11177
Box GEP, Jenkins GM (1970) Time series analysis: forecasting and control. Holden-Day, San Francisco, CA
Box GEP, Newbold P (1971) Some comments on a paper of Coen, Gomme and Kendall. J Roy Stat Soc Ser A 134:229-240
Brillinger DR (1988) Maximum likelihood analysis of spike trains of interacting nerve cells. Biol Cybernet 59:189-200
Brody C (1999) Correlations without synchrony. Neural Comput 11:1537-1551
Cocco S, Leibler S, Monasson R (2009) Neuronal couplings between retinal ganglion cells inferred by efficient inverse statistical physics methods. Proc Natl Acad Sci USA 106:14058-14062
Cover TM, Thomas JA (1991) Elements of information theory. Wiley, New York, NY
Chornoboy ES, Schramm LP, Karr AF (1988) Maximum likelihood identification of neural point process systems. Biol Cybernet 59:265-275
Christopoulos VN, Boeff DV, Evans CD, Crowe DA, Amirikian B, Georgopoulos A, Georgopoulos AP (2012) A network analysis of developing brain cultures. J Neural Eng 9:046008
Christova P, Lewis SM, Jerde TA, Lynch JK, Georgopoulos AP (2011) True associations between resting fMRI time series based on innovations. J Neural Eng 8:046025
Dickson JW, Gerstein GL (1974) Interactions between neurons in auditory cortex of the cat. J Neurophysiol 37:1239-1261
Eytan D, Marom S (2006) Dynamics and effective topology underlying synchronization in networks of cortical neurons. J Neurosci 26:8465-8476
Ganmor E, Segev R, Schneidman E (2011a) The architecture of functional interaction networks in the retina. J Neurosci 31:3044-3054
Ganmor E, Segev R, Schneidman E (2011b) Sparse low-order interaction network underlies a highly correlated and learnable neural population code. Proc Natl Acad Sci USA 108:9679-9684
Georgopoulos AP, Karageorgiou E, Leuthold AC, Lewis SM, Lynch JK, Alonso AA, Aslam Z, Carpenter AF, Georgopoulos A, Hemmy LS, Koutlas IG, Langheim FJ, McCarten JR, McPherson SE, Pardo JV, Pardo PJ, Parry GJ, Rottunda SJ, Segal BM, Sponheim SR, Stanwyck JJ, Stephane M, Westermeyer JJ (2007) Synchronous neural interactions assessed by magnetoencephalography: a functional biomarker for brain disorders. J Neural Eng 4:349-355
Gerstein GL, Perkel DH (1969) Simultaneously recorded trains of action potentials: analysis and functional interpretation. Science 164:828-830
Granger CWJ, Newbold P (1974) Spurious regressions in econometrics. J Econometrics 2:111-120
Haugh LD (1976) Checking the independence of two covariance-stationary time series: a univariate residual cross-correlation approach. J Am Statist Assoc 71:378-385
Ikegaya Y, Aaron G, Cossart R, Aronov D, Lampl I, Ferster D, Yuste R (2004) Synfire chains and cortical songs: temporal modules of cortical activity. Science 304:559-564
Jaynes ET (1957) Information theory and statistical mechanics. Phys Rev 106:620–630
Jenkins GM, Watts DG (1968) Spectral analysis and its applications. Holden-Day, Oakland, CA
Landau LD, Lifshitz EM (1980) Statistical physics 3rd edn. Pergamon Press, Oxford, UK Lindsey BG, Morris KF, Shannon R, Gerstein GL (1997) Repeated patterns of distributed synchrony in neuronal assemblies. J Neurophysiol 78:1714–1719
Macke JH, Berens P, Ecker AS, Tolias AS, Bethge M (2009) Generating spike trains with specified correlation coefficients. Neural Comput 21:397–423
Macke JH, Opper M, Bethge M (2011) Common input explains higher-order correlations and entropy in a simple model of neural population activity. Phys Rev Lett 106:208102
Marre O, El Boustani S, Frégnac Y, Destexhe A (2009) Prediction of spatiotemporal patterns of neural activity from pairwise correlations. Phys Rev Lett 102:138101
Montani F, Ince RA, Senatore R, Arabzadeh E, Diamond ME, Panzeri S (2009) The impact of high-order interactions on the rate of synchronous discharge and information transmission in somatosensory cortex. Philos Transact A Math Phys Eng Sci 367:3297–3310
Nicolelis, MAL (ed) (2007) Methods for neural ensemble recordings. CRC Press, New York, NY
Nirenberg S, Victor J (2007) Analyzing the activity of large populations of neurons: how tractable is the problem? Curr Opin Neurobiol 17:397–400
Okatan M, Wilson MA, Brown EN (2005) Analyzing functional connectivity using a network likelihood model of ensemble neural spiking activity. Neural Comput 17:1927–1961
Ohiorhenuan IE, Mechler F, Purpura KP, Schmid AM, Hu Q, Victor JD (2010) Sparse coding and high-order correlations in fine-scale cortical networks. Nature 466:617–621
Palop JJ, Chin J, Mucke L (2006) A network dysfunction perspective on neurodegenerative diseases. Nature 443:768–773
Perkel DH, Gerstein GL, Moore GP (1967) Neuronal spike trains and stochastic point processes. II. Simultaneous spike trains. Biophys J 7:419–440
Prut Y, Vaadia E, Bergman H, Haalman I, Slovin H, Abeles M (1998) Spatiotemporal structure of cortical activity: properties and behavioral relevance. J Neurophysiol 79:2857–2874
Reid RC, Alonso JM (1995) Specificity of monosynaptic connections from thalamus to visual cortex. Nature 378:281–284
Roudi Y, Nirenberg S, Latham PE (2009) Pairwise maximum entropy models for studying large biological systems: when they can work and when they can't. PLoS Comput Biol 5:e1000380
Santos GS, Gireesh ED, Plenz D, Nakahara H (2010) Hierarchical interaction structure of neural activities in cortical slice cultures. J Neurosci 30:8720–8733
Shannon C (1948) A mathematical theory of communication. Bell Syst Tech J 27:379–423
Schneidman E, Berry M, Segev R, Bialek W (2006) Weak pairwise correlations imply strongly correlated network states in a neural population. Nature 440:1007–1012
Shlens J, Field GD, Gauthier JL, Grivich MI, Petrusca D, Sher A, Litke AM, Chichilnisky EJ (2009) Spatial organization of large-scale concerted activity in the primate retina. J Neurosci 29:5022–5031
Shlens J, Field GD, Gauthier JL, Greschner M, Sher A, Litke AM, Chichilnisky EJ (2006) The structure of multi-neuron firing patterns in primate retina. J Neurosci 26:8254–8266
Sillito AM, Jones HE, Gerstein GL, West DC (1994) Feature-linked synchronization of thalamic relay cell firing induced by feedback from the visual cortex. Nature 369:479–482
Sporns O (2010) Networks of the Brain. MIT Press, Cambridge, MA
Stevenson IH, Rebesco JM, Hatsopoulos NG, Haga Z, Miller LE, Körding KP (2009) Bayesian inference of functional connectivity and network structure from spikes. IEEE Trans Neural Syst Rehabil Eng 17:203–213
Stevenson IH, Kording KP (2011) How advances in neural recording affect data analysis. Nat Neurosci 14:139–42
Tang A, Jackson D, Hobbs J, Chen W, Smith JL, Patel H, Prieto A, Petrusca D, Grivich MI, Sher A, Hottowy P, Dabrowski W, Litke AM, Beggs JM (2008) A maximum entropy model applied to spatial and temporal correlations from cortical networks in vitro. J Neurosci 28:505-518
Truccolo W, Eden UT, Fellows MR, Donoghue JP, Brown EN (2005) A point process framework for relating neural spiking activity to spiking history, neural ensemble and extrinsic covariate effects. J Neurophysiol 93:1074-1089
Truccolo W, Hochberg LR, Donoghue JP (2010) Collective dynamics in human and monkey sensorimotor cortex: predicting single neuron spikes. Nat Neurosci 13:105-111
Ts'o D, Gilbert C, Wiesel T (1986) Relationships between horizontal interactions and functional architecture in cat striate cortex as revealed by cross-correlation analysis. J Neurosci 6:1160-1170
Tsodyks M, Kenet T, Grinvald A, Arieli A (1999) Linking spontaneous activity of single cortical neurons and the underlying functional architecture. Science 286:1943-1946
Yu S, Huang D, Singer W, Nikolic D (2008) A small world of neuronal synchrony. Cereb Cortex 18:2891-2901
Yu S, Yang H, Nakahara H, Santos GS, Nikolić D, Plenz D (2011) Higher-order interactions characterized in cortical activity. J Neurosci 31:17514-17526